How to Identify and Report AI Traffic in Google Analytics 4 (GA4)
AI-generated traffic is increasingly relevant for marketers and businesses, with more visitors arriving via AI-driven platforms every day. Yet, unlike traditional channels such as organic search or social media, GA4 does not automatically identify traffic from AI sources. Without a proper setup, this valuable data remains hidden, making it hard to understand and leverage this growing channel.
In this guide, we’ll show you exactly how to track, identify, and generate clear reports on AI-driven traffic using Google Analytics 4. This guide assumes you’ve already configured GA4 and GTM setups.
How to track AI traffic as a traffic channel
Most traffic from AI sources is categorised as general referrals at the moment. By creating a custom channel group, you can separate these visits for more precise analysis and actionable insights.
Also, the channel grouping in GA4 applies retroactively, which means you can start benefiting from this new channel configuration for AI traffic without having to wait for new data.
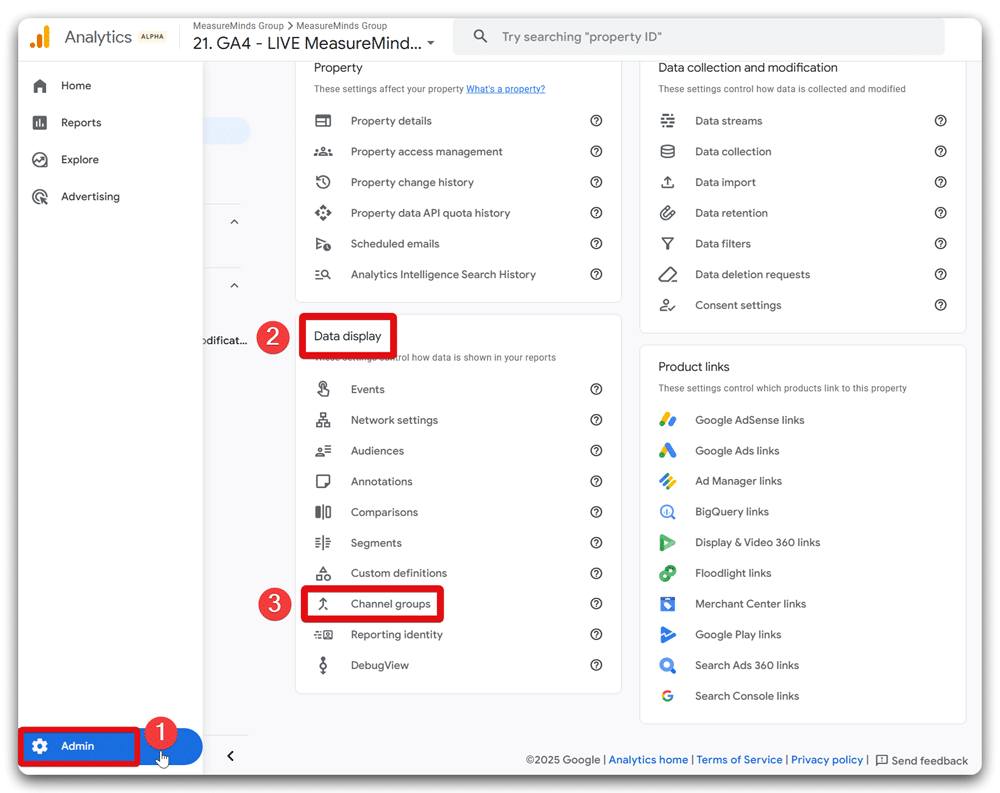
Step 1: Locate channel groups in GA4 admin
Log in to your GA4 account and head to the Admin section. Once there, navigate to the section labelled “Data display” and click on “Channel groups.”
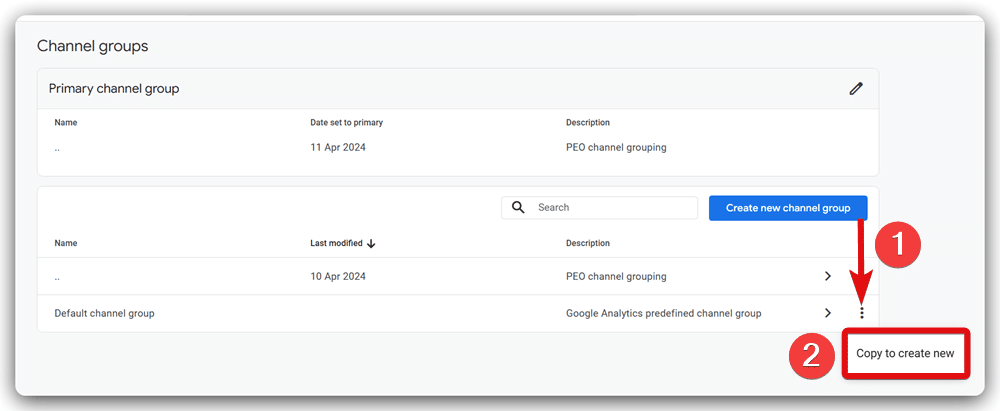
Next, locate the default channel group provided by GA4. Click the three-dot menu beside it and select the option “Copy to create new.”
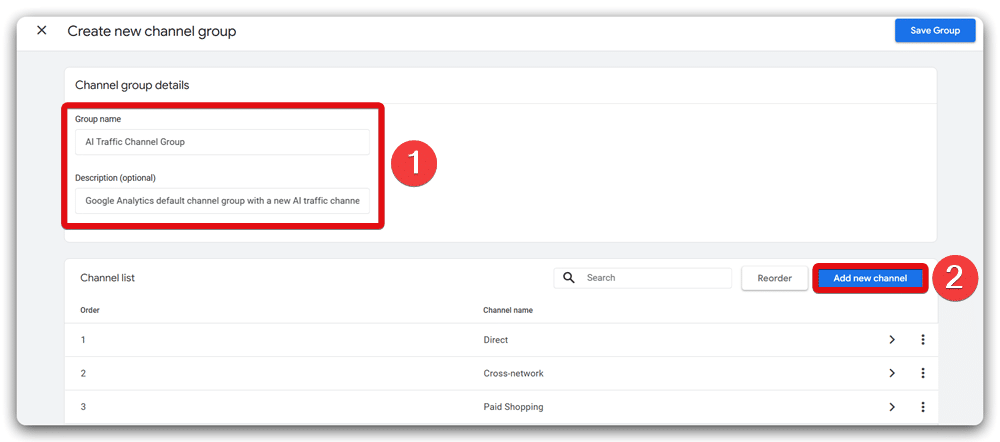
Step 2: Create a dedicated AI traffic channel group
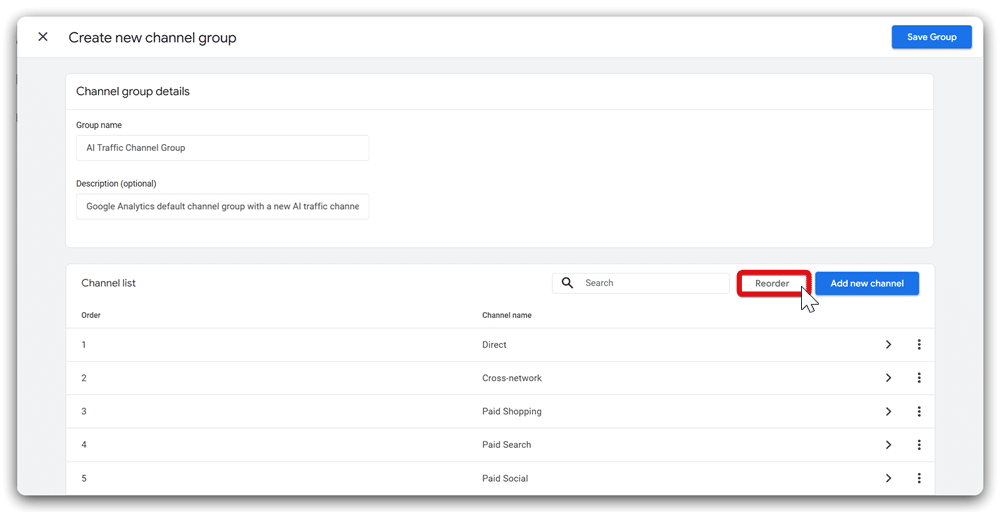
Give the newly created channel group a clear, descriptive name like “AI Traffic Channel Group,” and also update the group’s description for future reference. Then, click the “Add new channel” button to begin defining the AI-specific traffic channel.
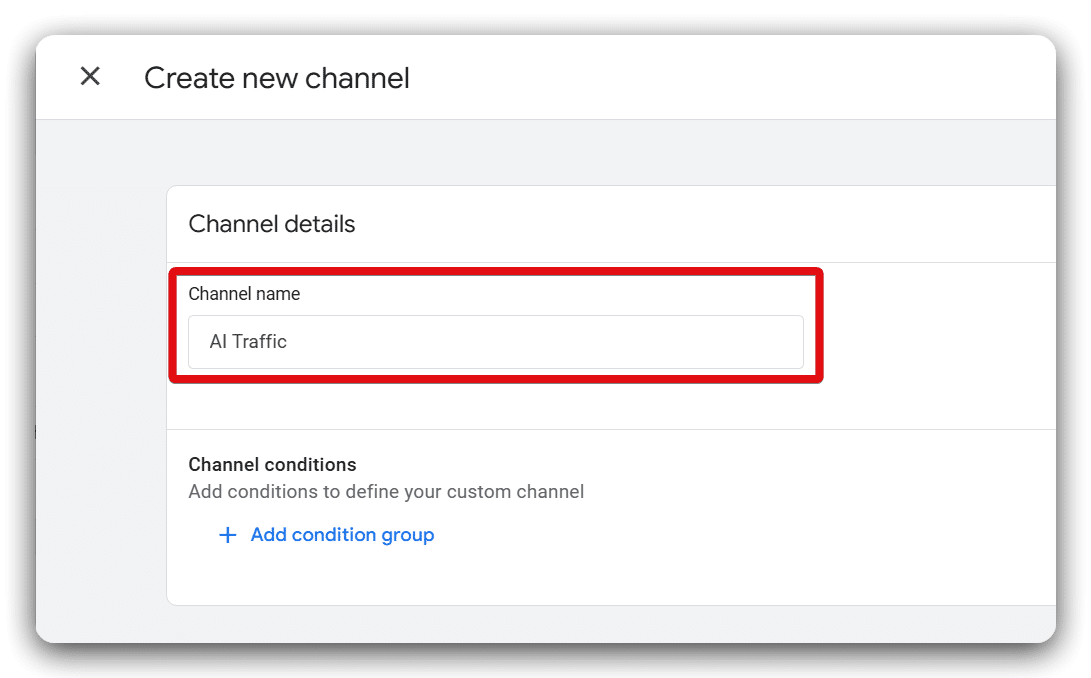
Enter “AI Traffic” as the channel name.
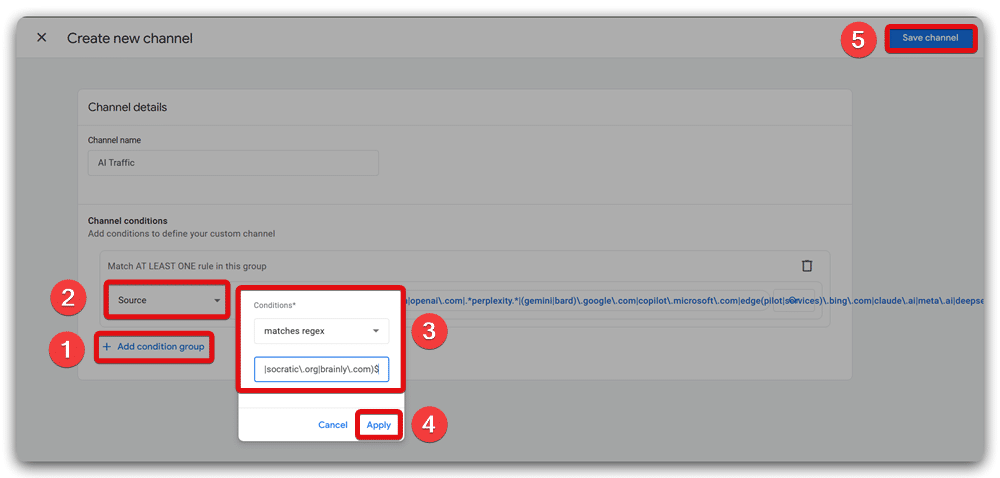
To accurately capture AI-related referrals, click the “Add condition group” button. In the new condition, select “source,” then “matches regex,” and input this regex pattern designed to identify popular AI-based referrers:
^(.+?\.)?(chatgpt\.com|openai\.com|.*perplexity.*|(gemini|bard)\.google\.com|copilot\.microsoft\.com|edge(pilot|services)\.bing\.com|claude\.ai|meta\.ai|deepseek\.com|anthropic\.com|blackbox\.ai|poe\.com|mistral\.ai|huggingface\.co|you\.com|phind\.com|pi\.ai|consensus\.app|iask\.ai|komo\.ai|andi\.ai|forefront\.ai|arc\.net|qwen\.ai|bagoodex\.io|getmerlin\.in|khanmigo\.ai|reka\.ai|ora\.sh|writesonic\.com|ai21\.com|socratic\.org|brainly\.com)$
After pasting the regular expression, click the “Apply” button & then the “Save channel” button.
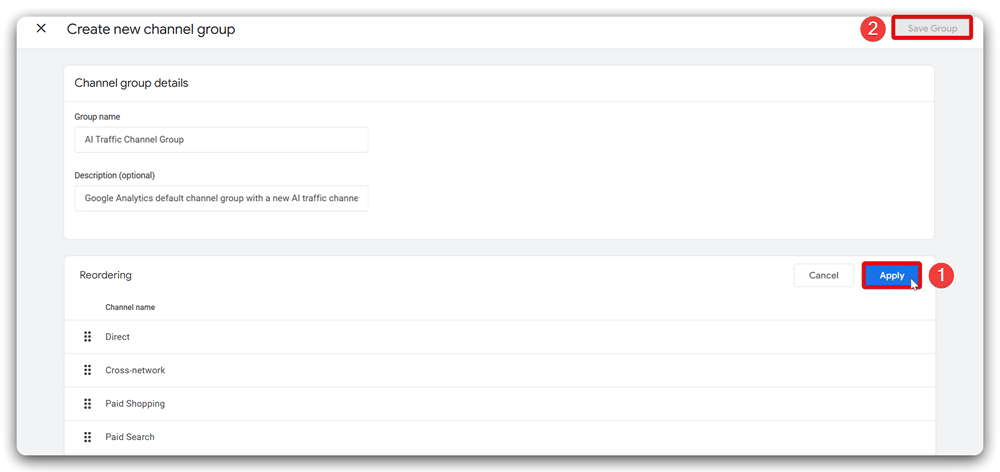
Next, select “Reorder” and move your AI Traffic channel just above the “Referral” channel. This ensures AI referrals are identified correctly, preventing misclassification under generic referrals.
Finish this step by clicking “Apply” and then “Save group.”
Step 3: View and analyse AI traffic in GA4 reports
Navigate to the standard reporting section by selecting Reports, then Acquisition, and finally, Traffic Acquisition Report.
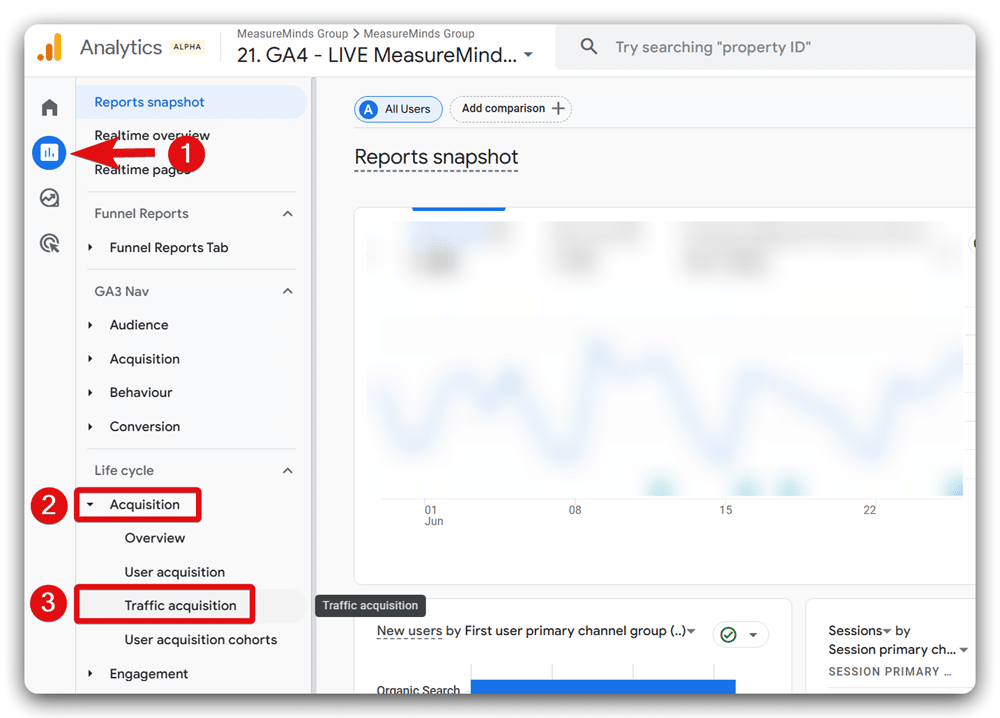
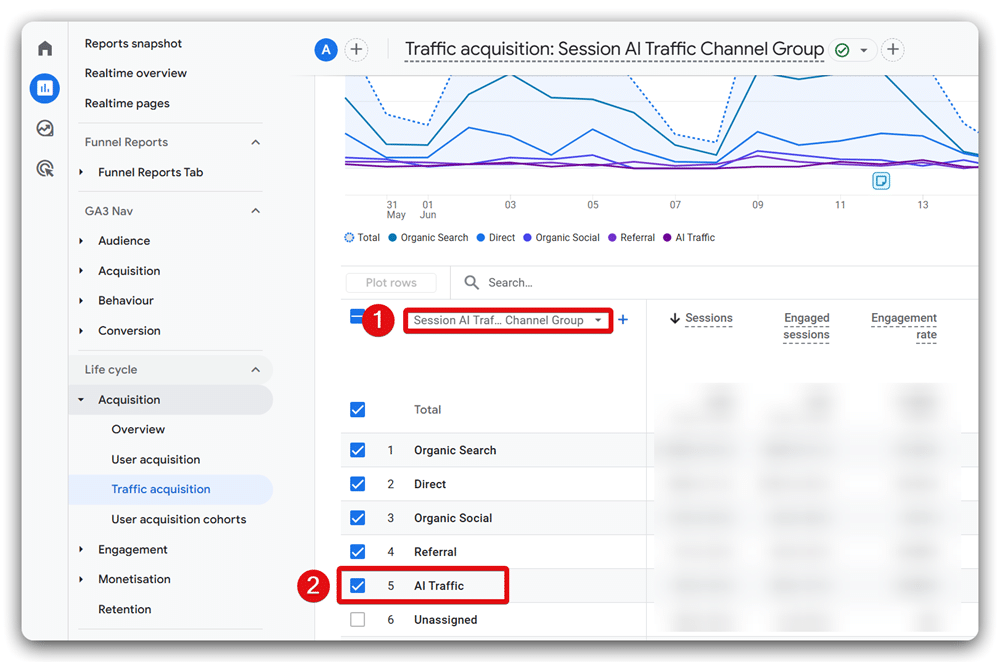
In the data table below, set the primary dimension to your newly created channel group. If your setup is correct and AI-driven visitors are accessing your site, you’ll notice data reported under “AI Traffic.”
To isolate this traffic quickly, type “AI Traffic” into the search bar and press Enter. Then, add “Session source/medium” as a secondary dimension. This will help you distinguish legitimate visits from automated bots.
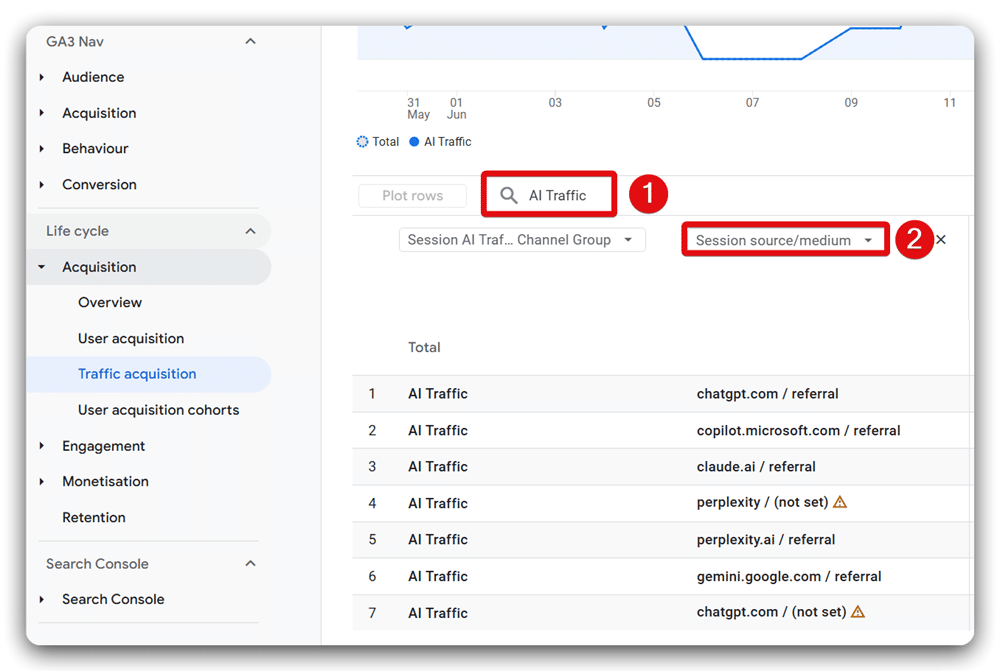
Bot traffic often appears with zero engaged sessions and zero engagement time. Genuine AI-driven referrals like ChatGPT typically have “referral” indicated as their medium.
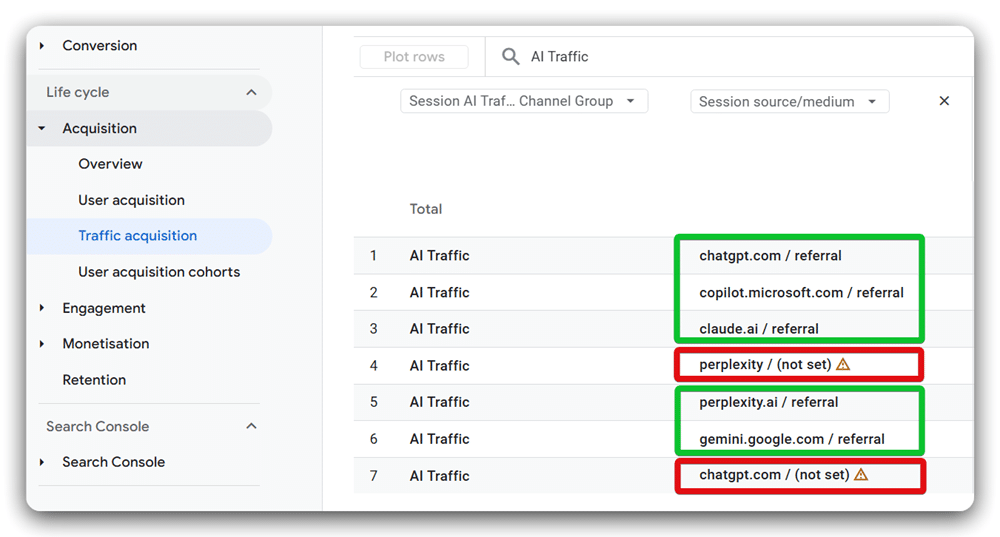
If you see “(not set)” as medium which often signals malformed data, commonly associated with automated or bot-driven activity. Always verify data integrity before analysing or reporting.
Creating AI Traffic Exploration Reports in Google Analytics 4 (GA4)
To effectively analyse AI-driven traffic using GA4, we’ll create a custom exploration report consisting of nine individual tabs. Each tab will cover a specific aspect of AI traffic, providing actionable insights.
Report 1: Setting up the ‘Overview’ report
Sign in to your GA4 account. Navigate to ‘Explore‘ located on the sidebar and select the ‘Blank‘ exploration report template.
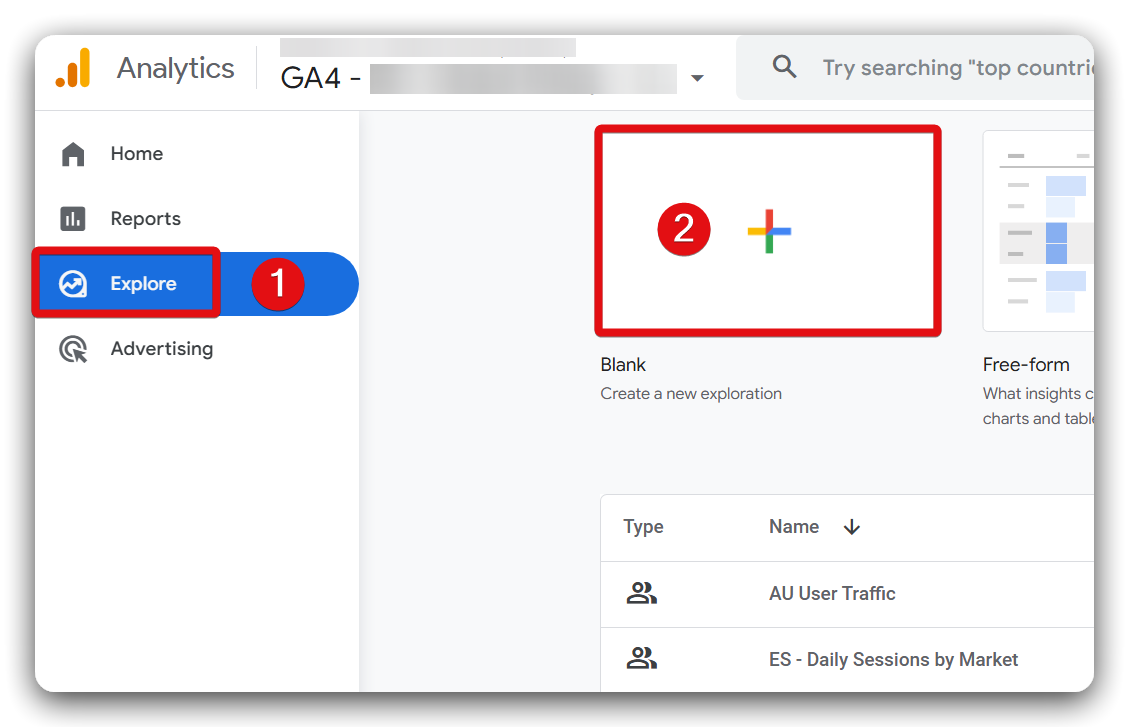
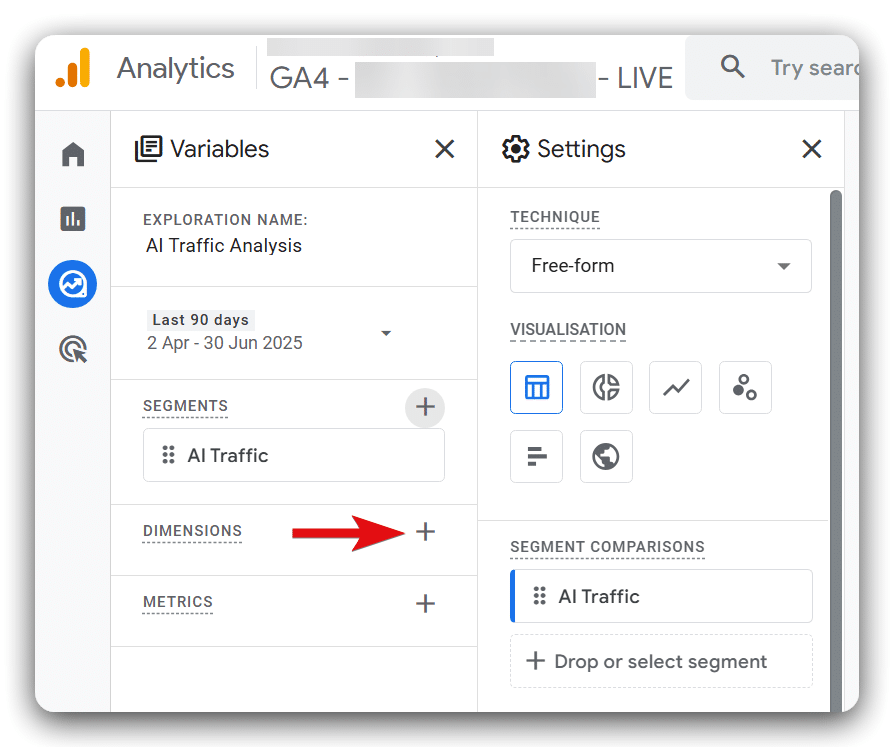
Name your report clearly, such as ‘AI Traffic Analysis,’ and set the date range to cover the past 30 days. Next, click the plus (+) button next to the “SEGMENTS” option.
![]()
![]()
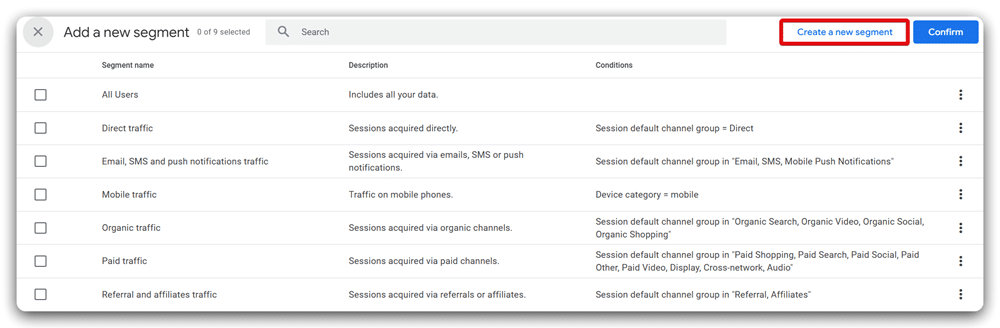
In the subsequent window, select the button labeled ‘Create a new segment‘.
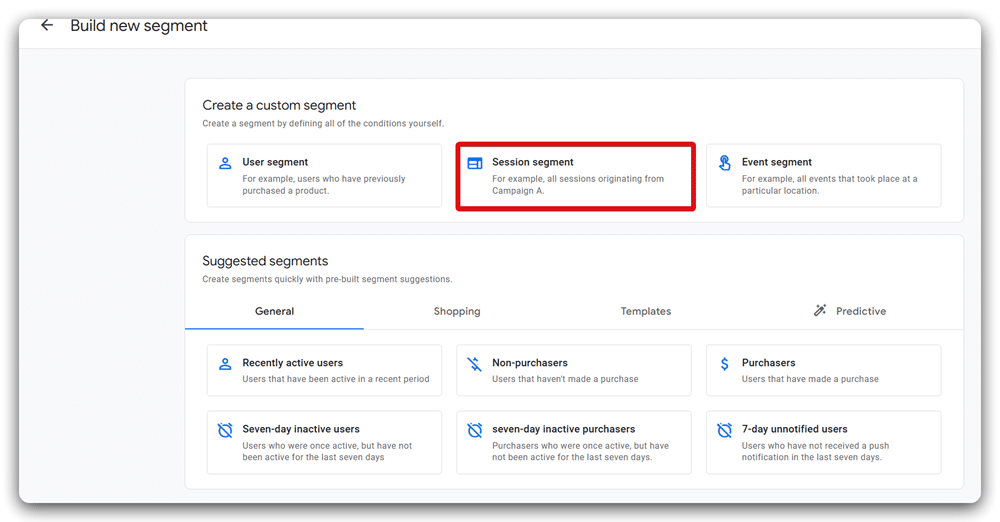
From the build new segment window, click on the ‘Session segment‘ button.
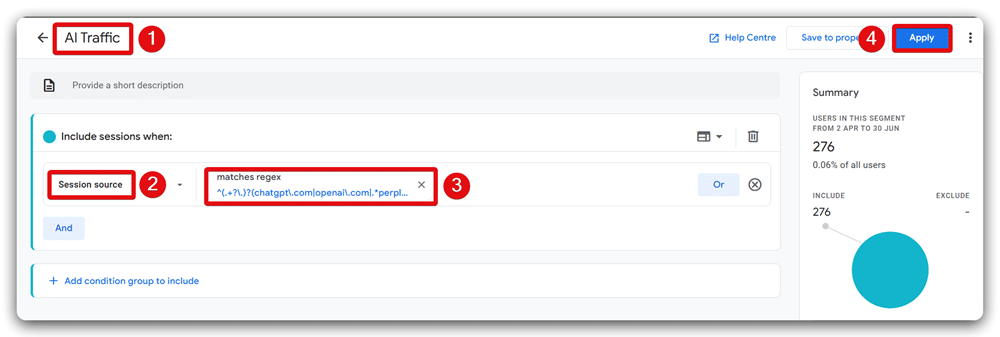
Configure the segment precisely as follows:
Segment Name: AI Traffic
Include events when:
Session source matches regex:
^(.+?\.)?(chatgpt\.com|openai\.com|.*perplexity.*|(gemini|bard)\.google\.com|copilot\.microsoft\.com|edge(pilot|services)\.bing\.com|claude\.ai|meta\.ai|deepseek\.com|anthropic\.com|blackbox\.ai|poe\.com|mistral\.ai|huggingface\.co|you\.com|phind\.com|pi\.ai|consensus\.app|iask\.ai|komo\.ai|andi\.ai|forefront\.ai|arc\.net|qwen\.ai|bagoodex\.io|getmerlin\.in|khanmigo\.ai|reka\.ai|ora\.sh|writesonic\.com|ai21\.com|socratic\.org|brainly\.com)$
Then click the ‘Apply‘ button to add it in your report.
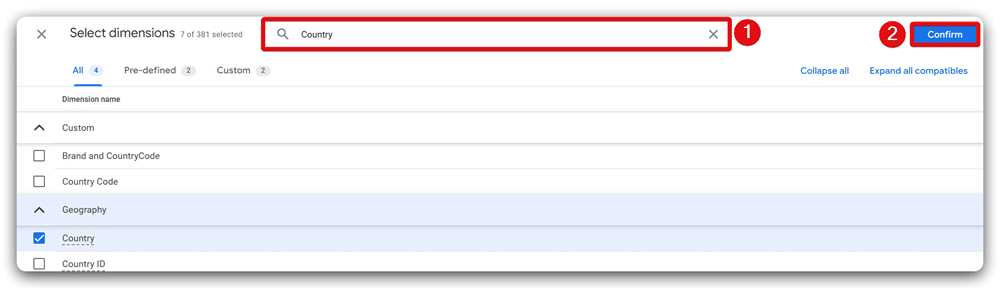
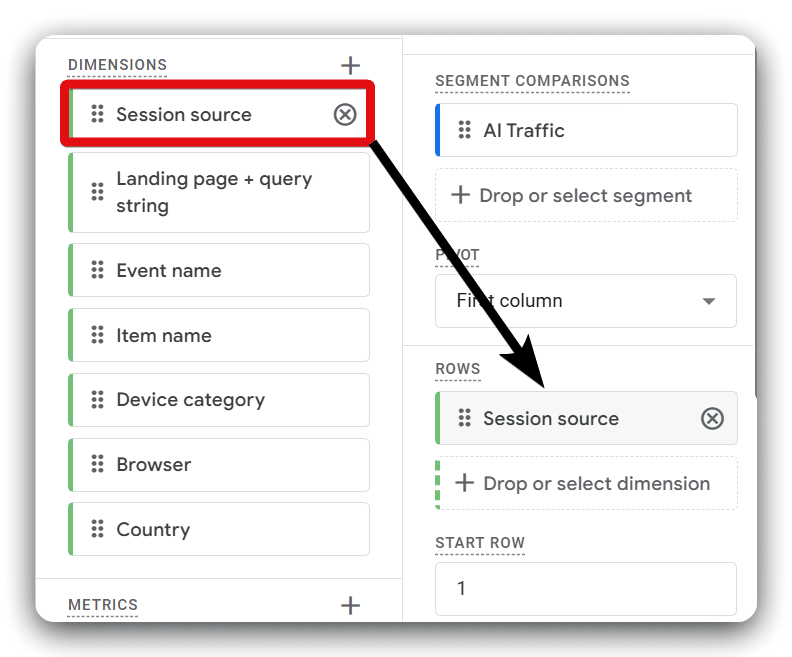
Proceed by clicking the plus (+) button beside the ‘DIMENSIONS‘ section.
You’ll see a new window, use its search functionality to find and select the following dimensions individually:
- Session source
- Landing Page + query string
- Event Name
- Item Name
- Device Category
- Browser
- Country
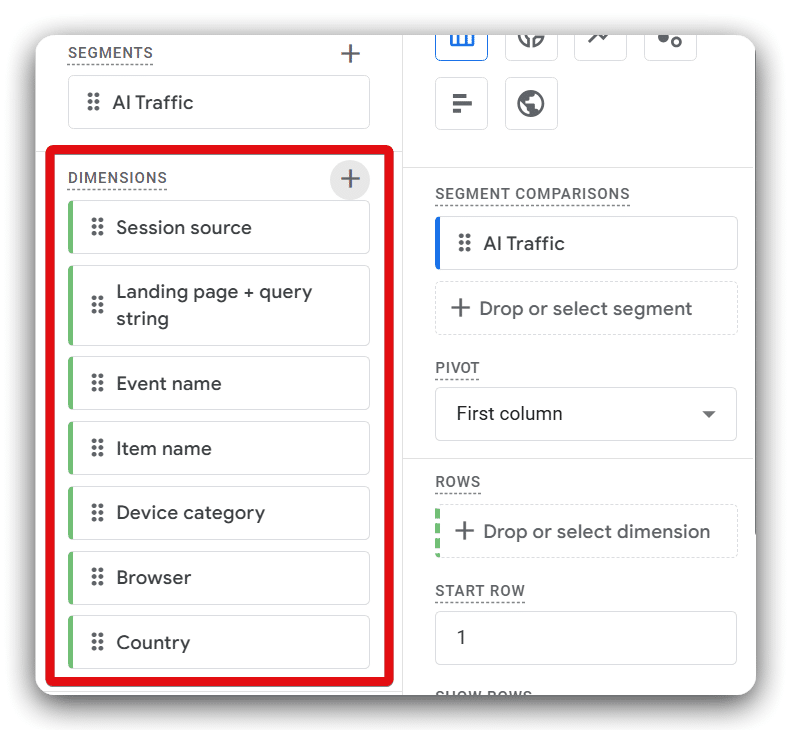
After selecting these dimensions, click ‘Import‘ button to include them in your report.
The dimensions you’ve imported will now appear in the dimensions list.
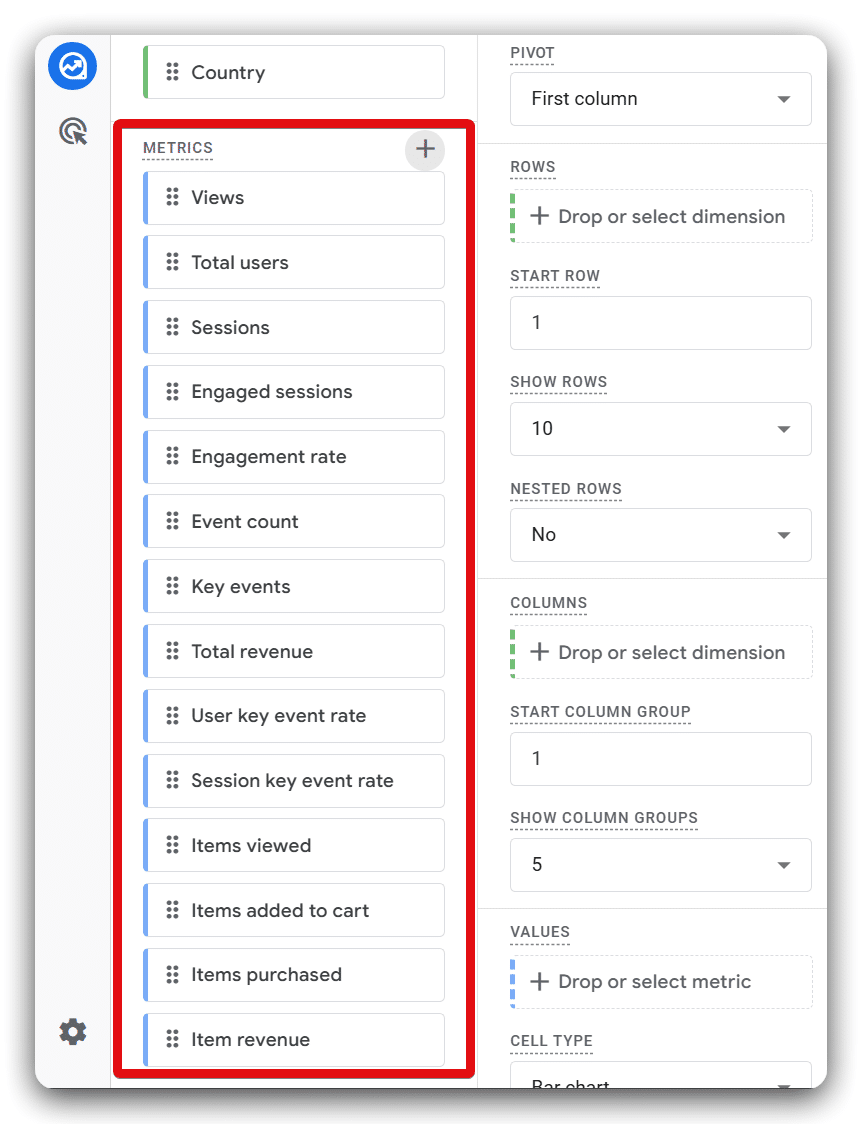
Next, click the plus (+) icon beside the ‘METRICS‘ section.
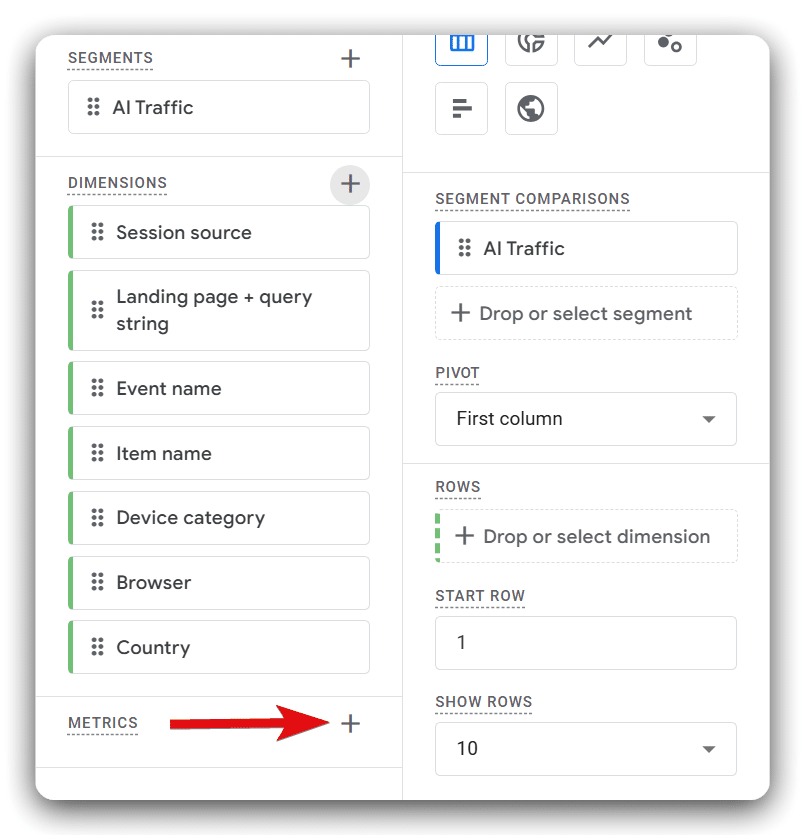
Search and select these metrics sequentially, then import them as we did for the dimensions:
- Views
- Total users
- Sessions
- Engaged sessions
- Engagement rate
- Event Count
- Key events
- Total revenue
- User key event rate
- Session key event rate
- Items viewed
- Items added to cart
- Items purchased
- Item revenue
These metrics will appear in the metrics section.
Add the dimension ‘Session source’ to your report canvas by double-clicking it.
Then, sequentially add the following metrics to your report canvas by double-clicking each:
- Views
- Total users
- Sessions
- Engaged sessions
- Engagement rate
- Event Count
- Key events
- Total revenue
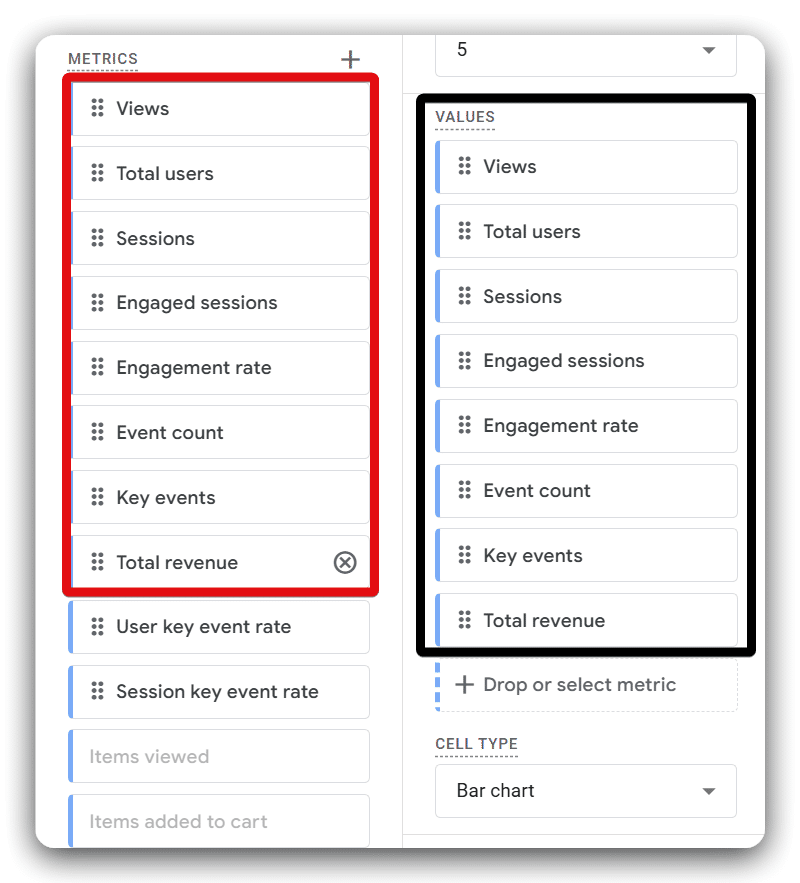
Your canvas should now show the selected dimensions and metrics clearly.
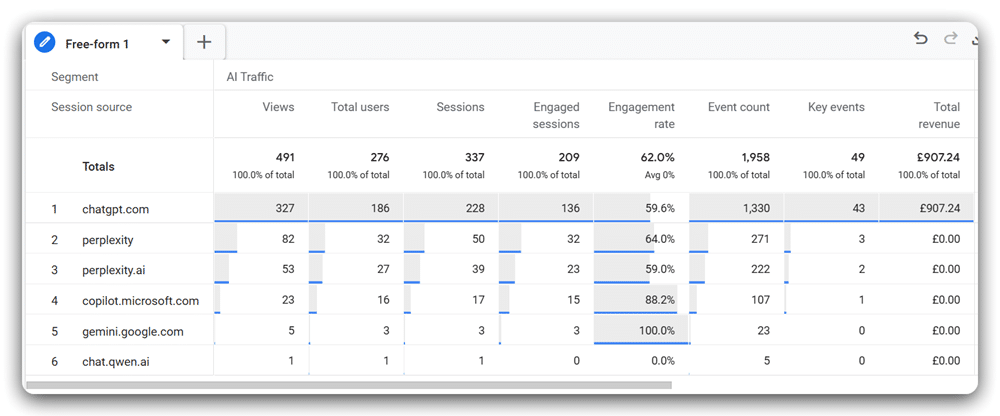
In the settings area, change the cell type to ‘Heat Map’ for better visualization. Then, rename this tab as ‘Overview‘. Your report is now ready, as shown below.
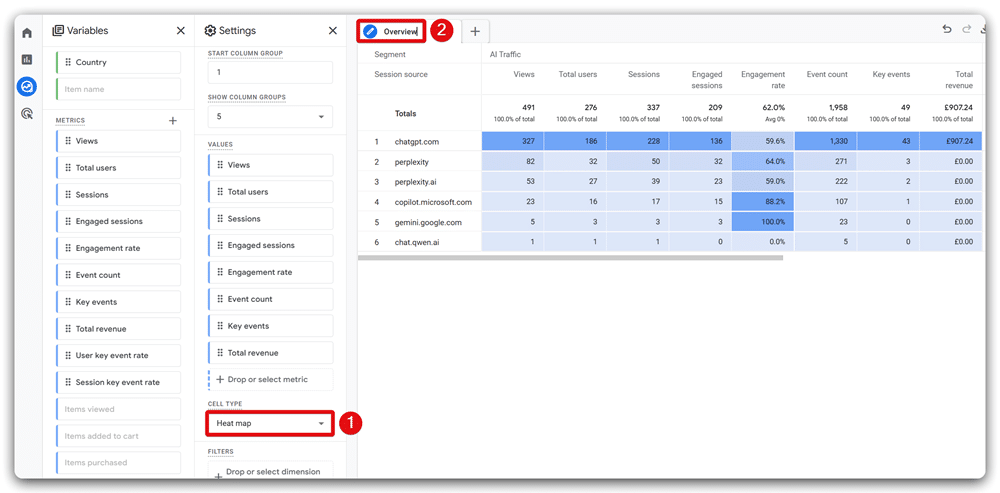
You’ve successfully created your ‘Overview’ report.
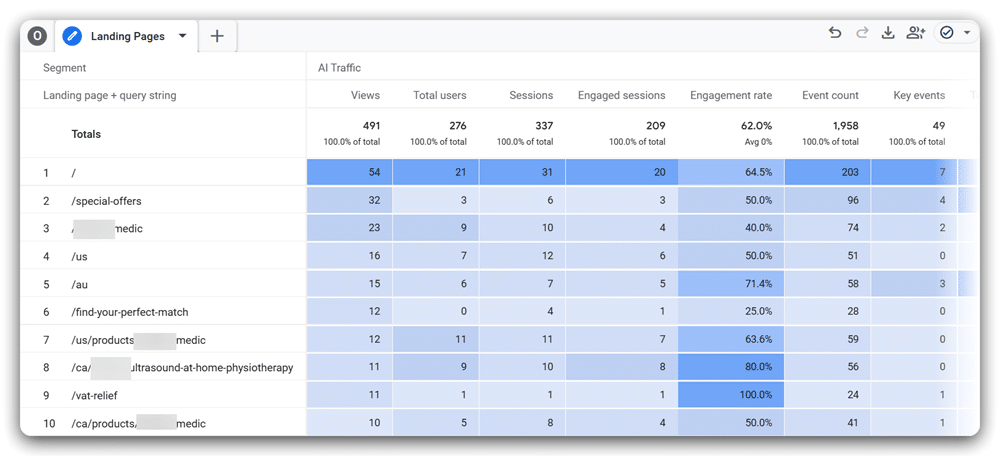
Report 2: Setting up the ‘Landing Pages’ report
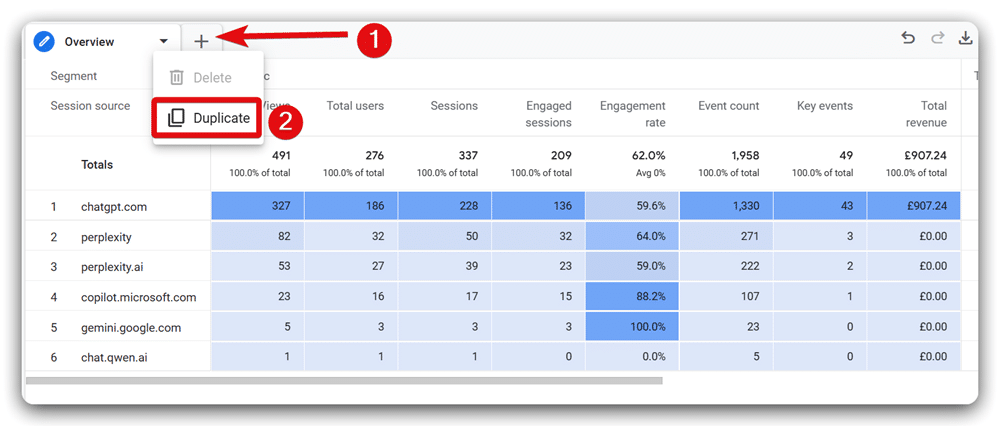
To create the next report, click the arrow icon beside the ‘Overview‘ report and select ‘Duplicate” from the dropdown menu.
Rename this new duplicated tab to ‘Landing Pages‘ by double-clicking on the existing name.
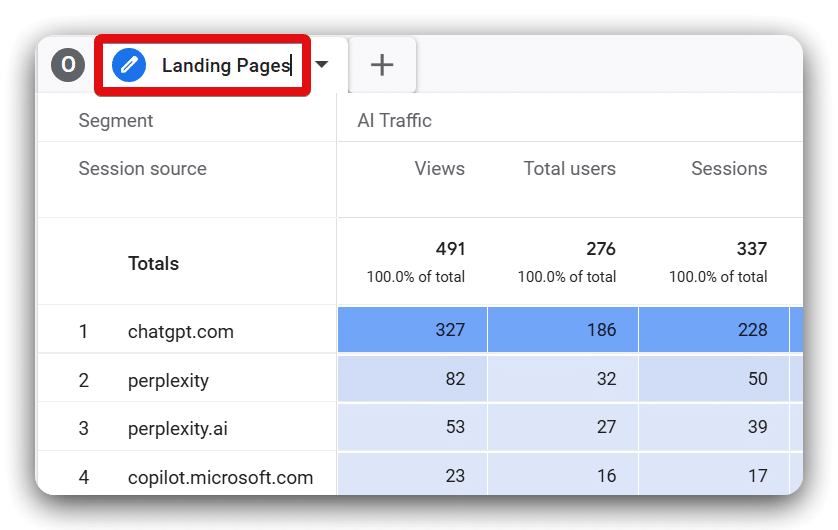
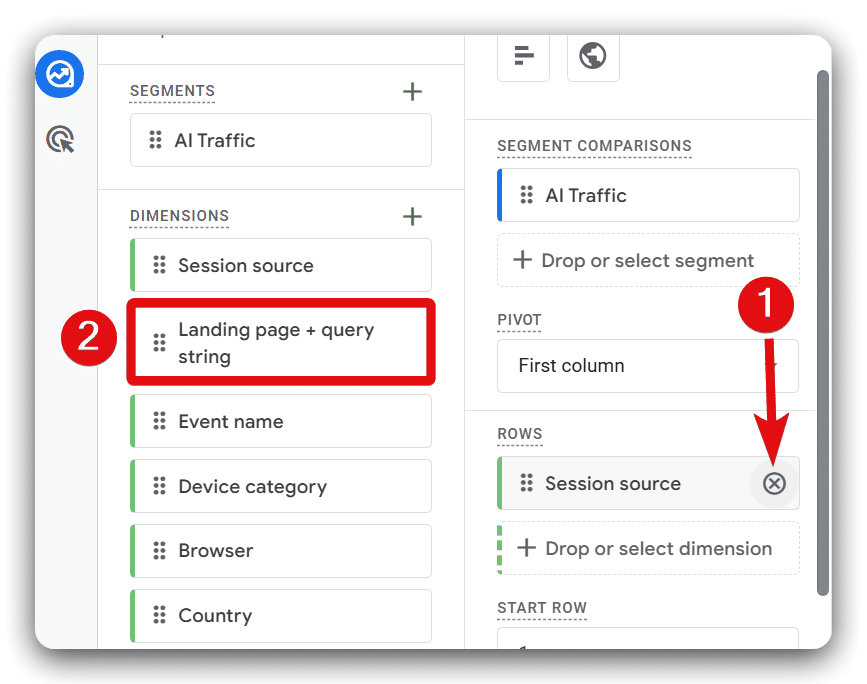
Remove the ‘Session source‘ dimension from this report by clicking on the cross button next to it in the Rows section. Then, add the ‘Landing Page + query string‘ dimension by double-clicking on it.
Your ‘Landing Pages‘ report should now appear on your canvas.
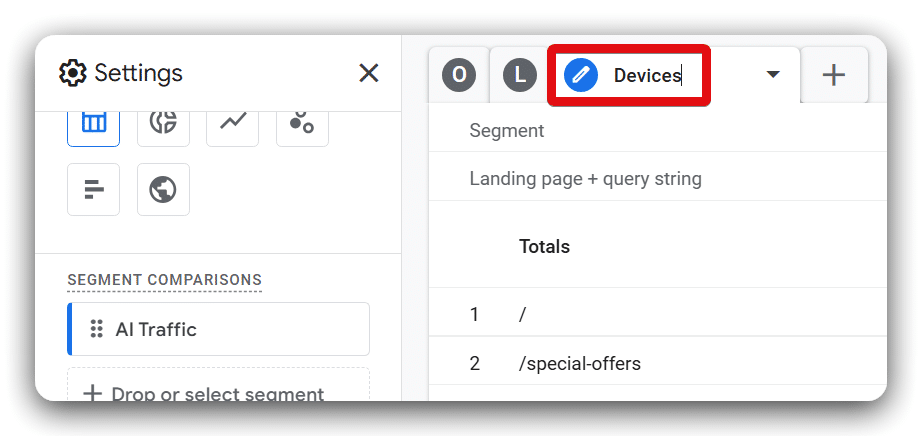
Report 3: Setting up the ‘Devices’ report
Duplicate the ‘Landing Pages‘ tab following the steps mentioned in the last report. Then, rename this duplicated tab to ‘Devices‘.
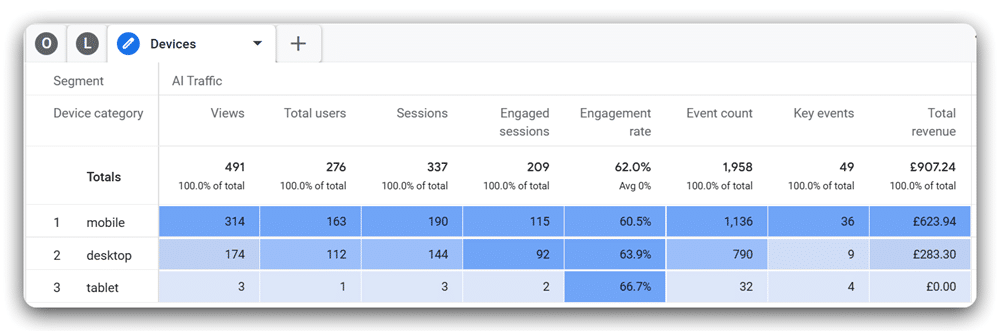
Remove the ‘Landing Page + query string‘ dimension. Replace it by adding the ‘Device Category’ dimension to your canvas.
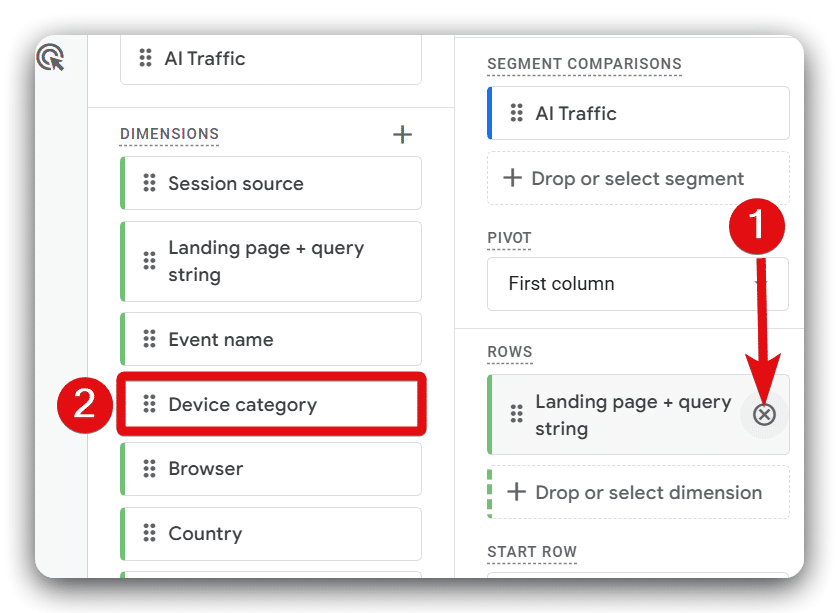
Your ‘Devices‘ report will now display in the report area.
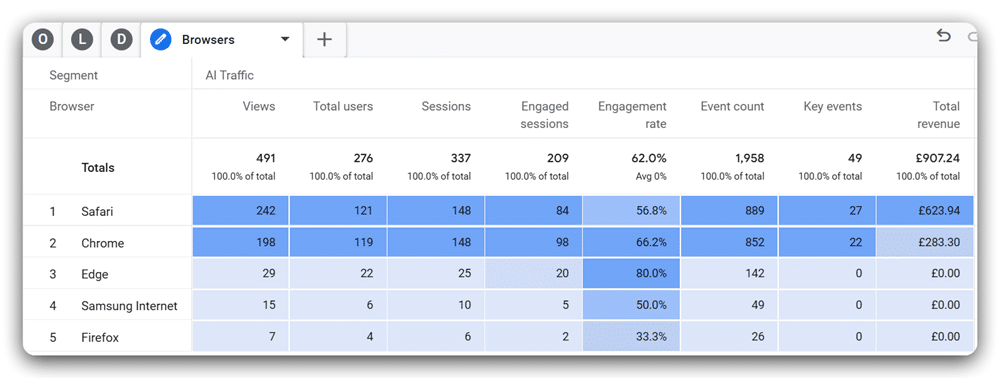
Report 4: Setting up the ‘Browsers’ report
Again, duplicate the ‘Devices‘ tab. Rename this duplicated tab to ‘Browsers‘.
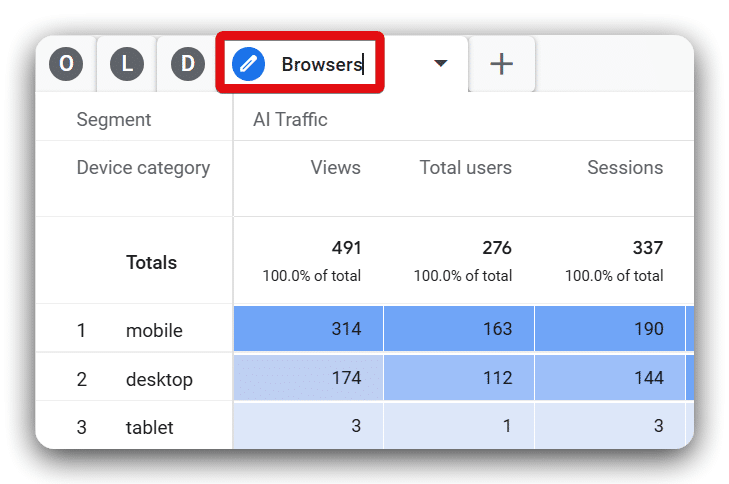
Remove the ‘Device Category‘ dimension from the Rows section and add the ‘Browser‘ dimension by double-clicking on it from the dimension list.
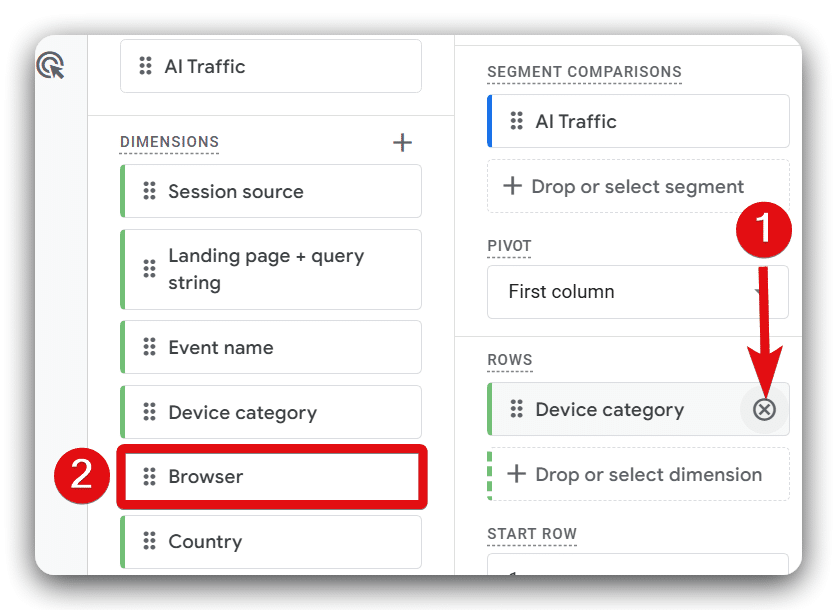
Your ‘Browsers‘ report is now ready for review.
Report 5: Setting up the ‘Countries’ report
Duplicate the ‘Browsers‘ tab and rename the new tab as ‘Countries‘.
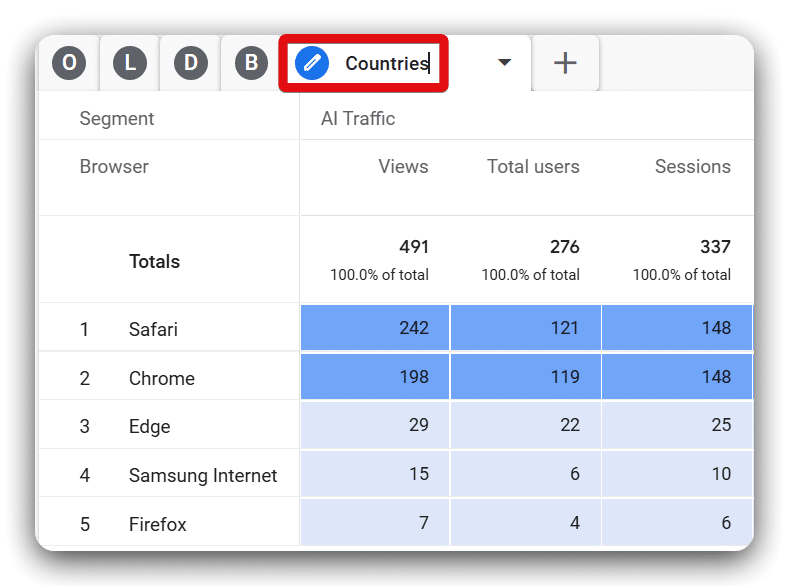
Remove the ‘Browser‘ dimension by clicking the cross button from the Rows section. Replace it by double-clicking on the ‘Country‘ dimension from the dimension list.
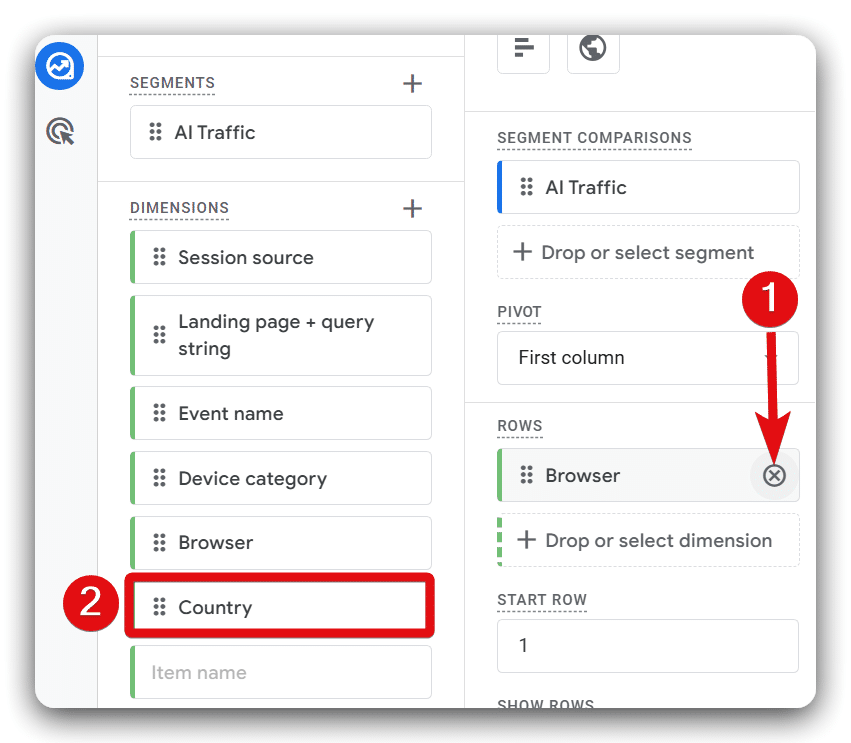
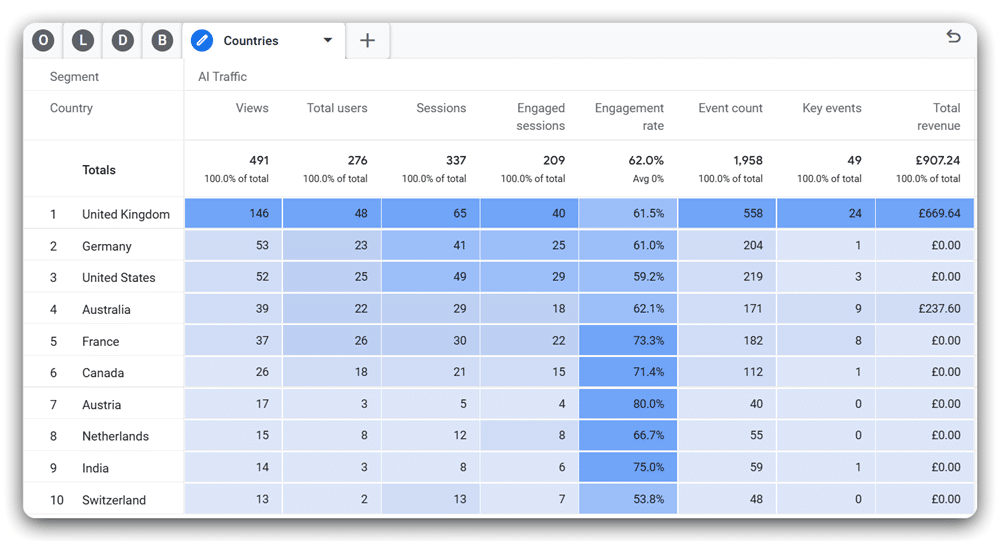
You will now see the ‘Countries‘ report on the canvas.
Report 6: Setting up the ‘Key Events’ report
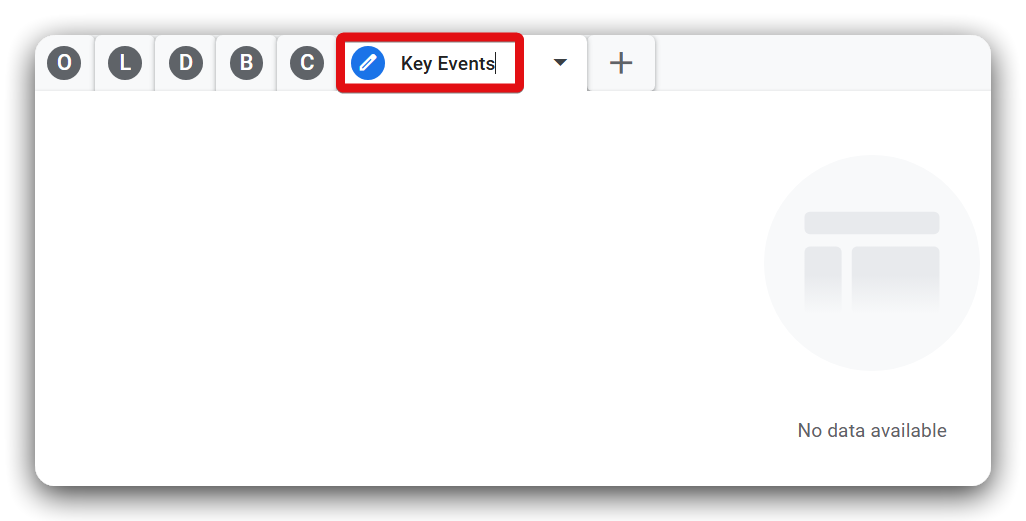
Create a new report tab by clicking the plus (+) button next to ‘Countries‘ and selecting ‘Free form‘ from the drop-down options.

Rename this tab to ‘Key Events‘ after removing the default name.
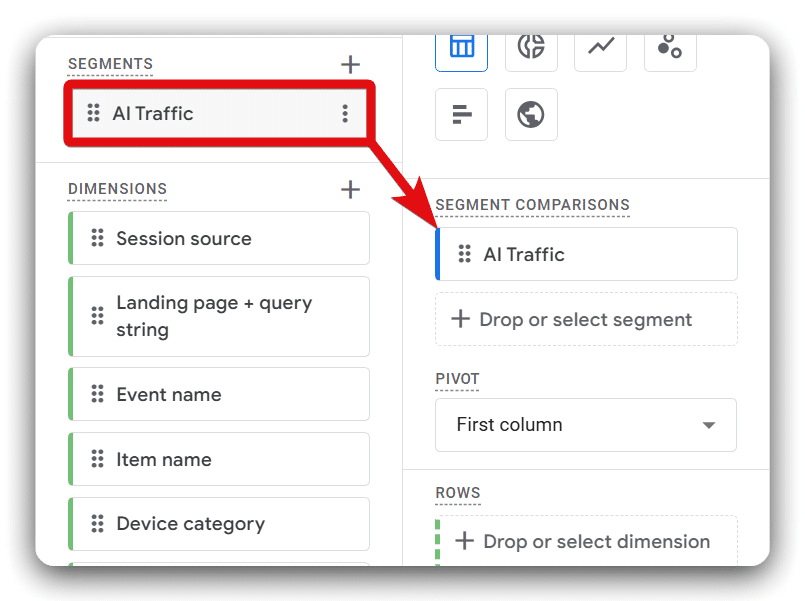
Apply the ‘AI Traffic‘ segment to the report by double-clicking on it.
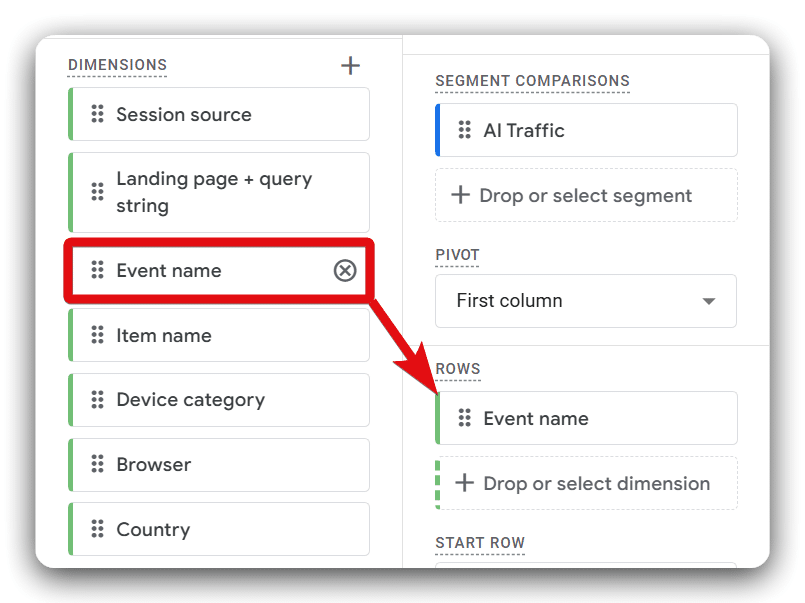
Add the dimension’Event name‘ to the report.
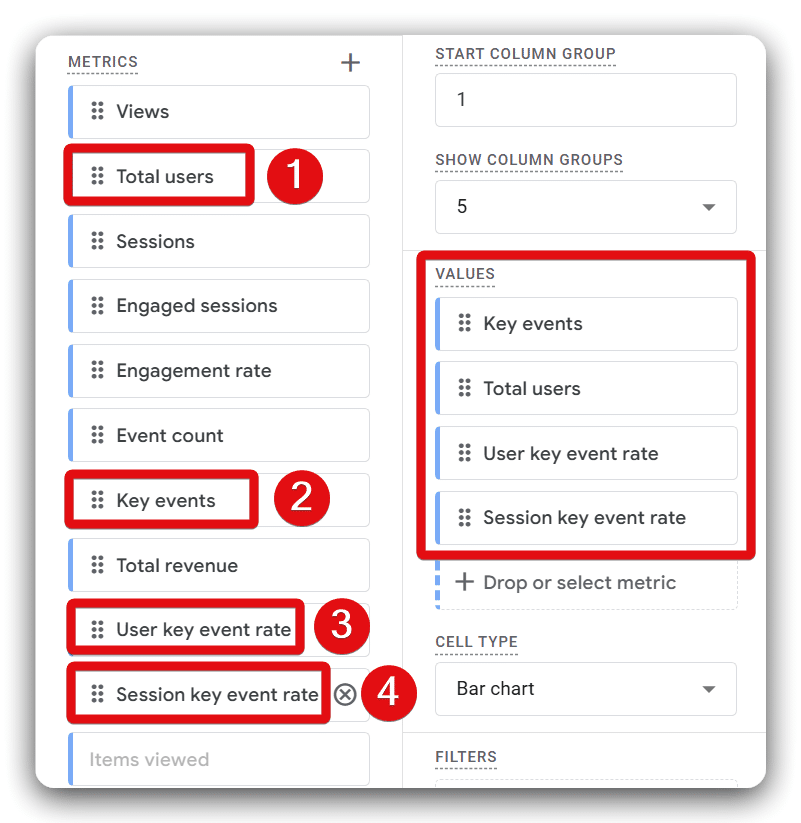
Sequentially add the following metrics:
- Key events
- Total users
- User key event rate
- Session key event rate
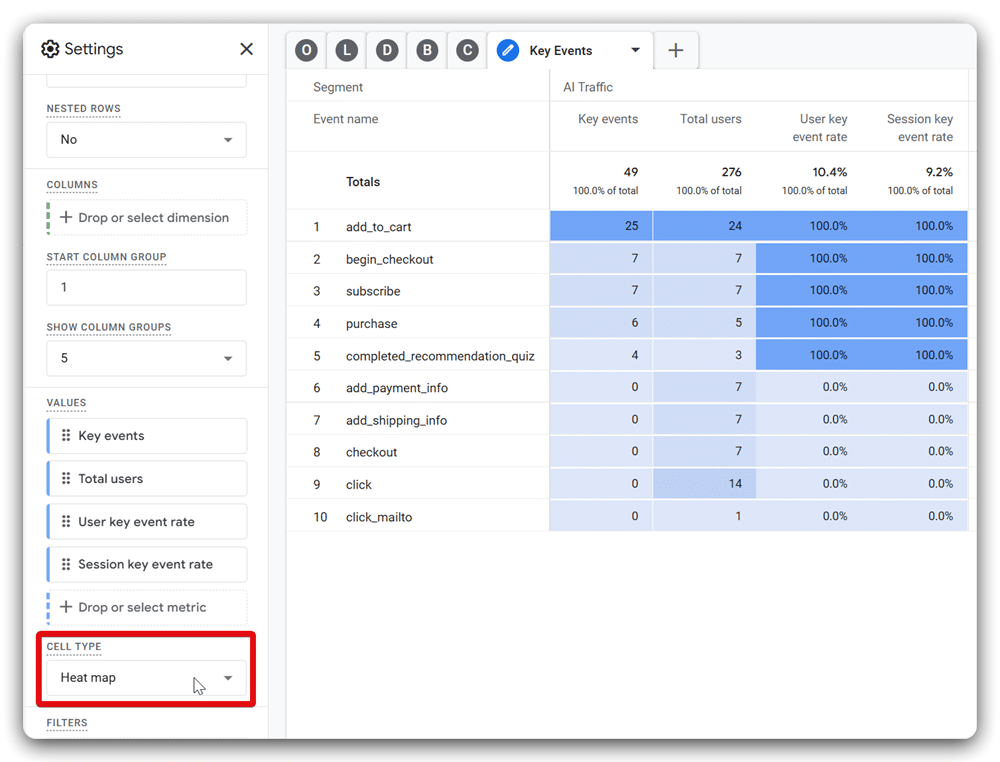
Change the cell type to ‘Heat map‘ for improved visualisation. Your completed ‘Key Events’ report should now appear.
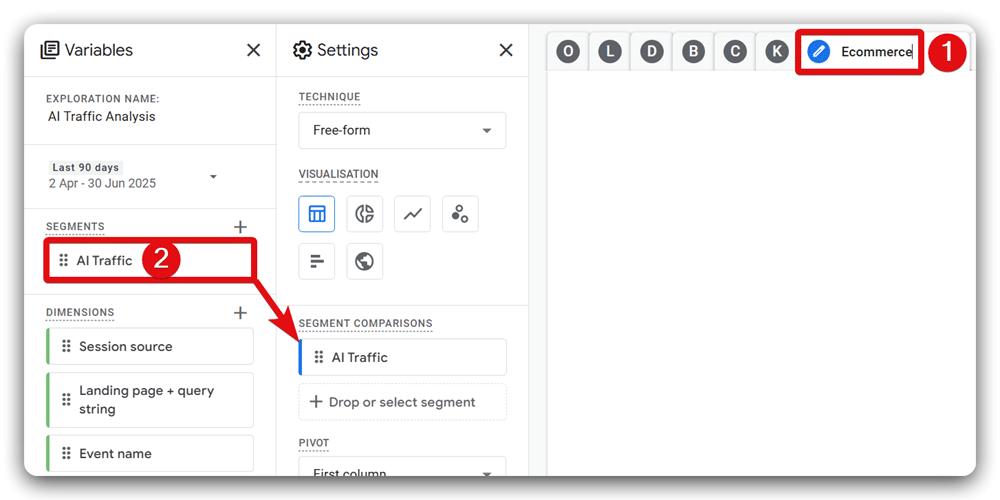
Report 7: Setting up the ‘Ecommerce‘ report
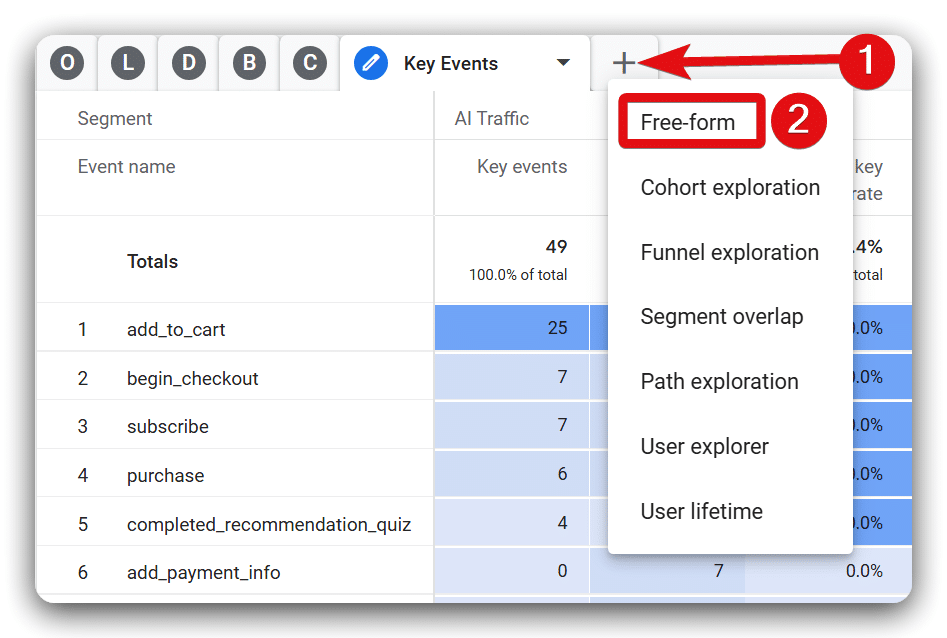
Click the plus (+) icon next to the ‘Key Events‘ report and choose ‘Free form‘ from the drop-down menu.
Now, rename this tab as ‘Ecommerce‘ & Include the ‘AI Traffic‘ segment by double-clicking on it.
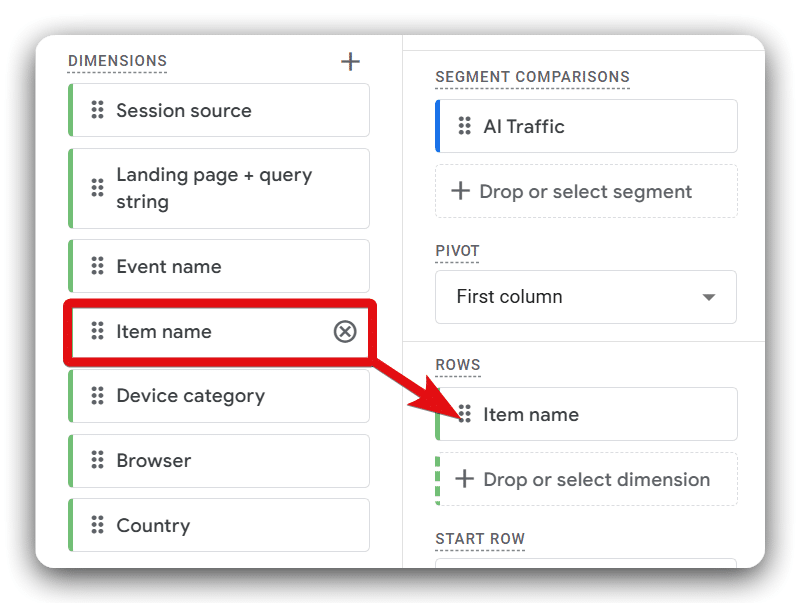
Double-click on the ‘Item name‘ from the dimension list to add it under the Rows section.
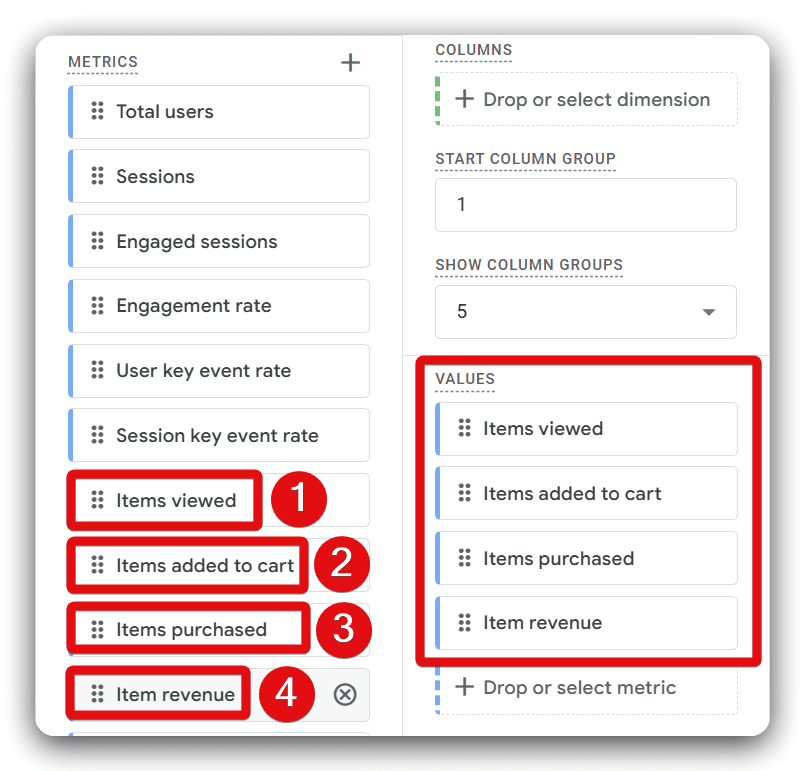
Now, double-click on the following metrics sequentially to add them to the reporting canvas:
- Items viewed
- Items added to cart
- Items purchased
- Item revenue
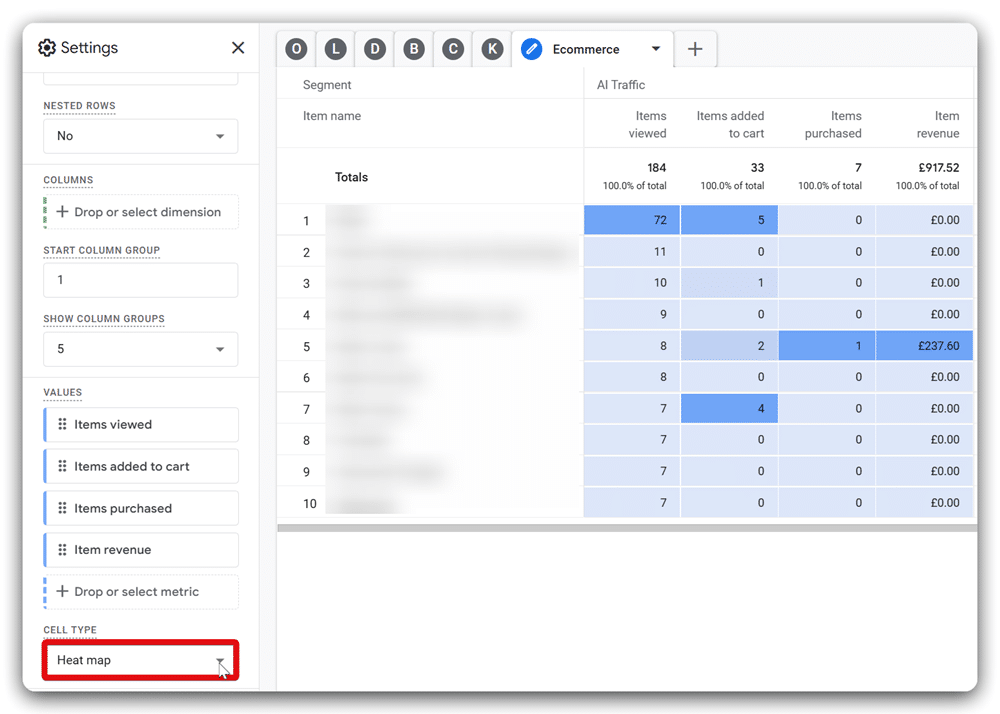
Select ‘Heat map‘ as your cell type for clear data visualization. Now, your ‘Ecommerce‘ report is ready to use.
Report 8: Setting up the ‘User Flow’ report
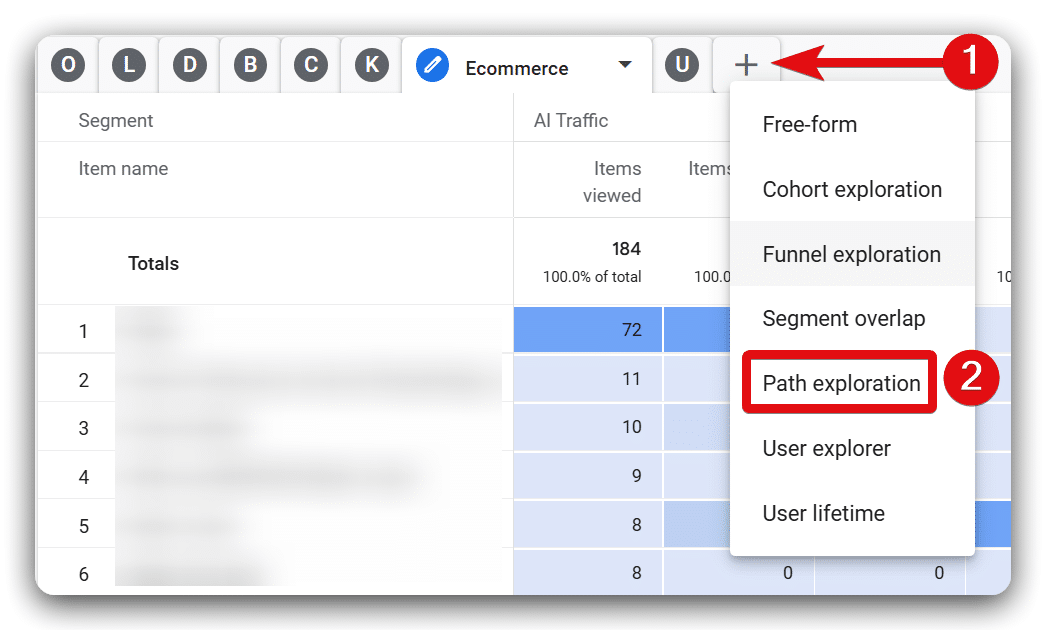
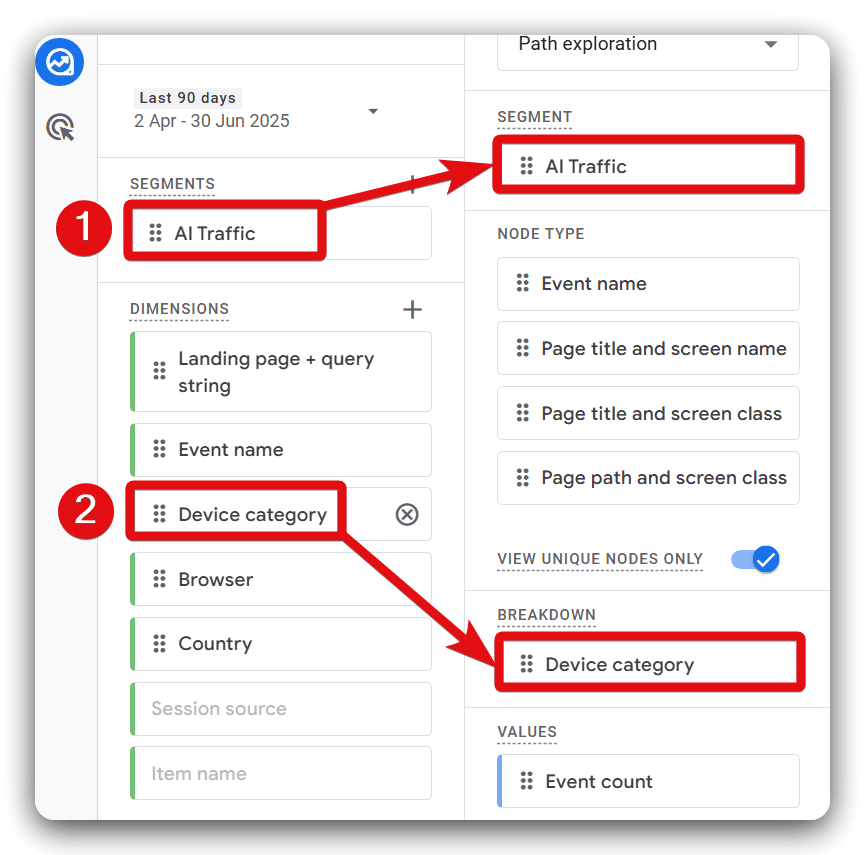
Click the plus (+) button beside ‘Ecommerce‘ report and select ‘Path exploration‘ from the drop-down options.
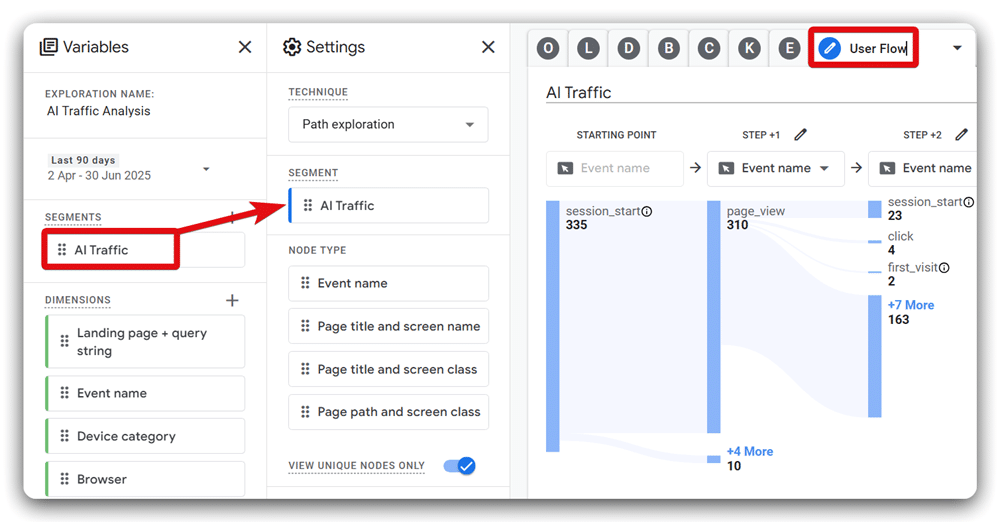
Rename this new tab as ‘User Flow.’ Then, apply the ‘AI Traffic‘ segment to the report by double-clicking on it.
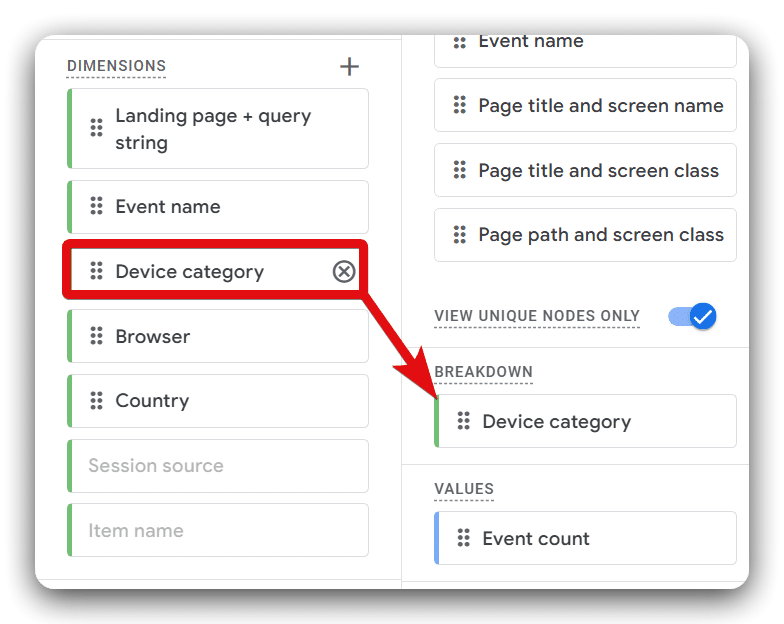
Include ‘Device Category’ as breakdown by double-clicking on it from the dimensions list.
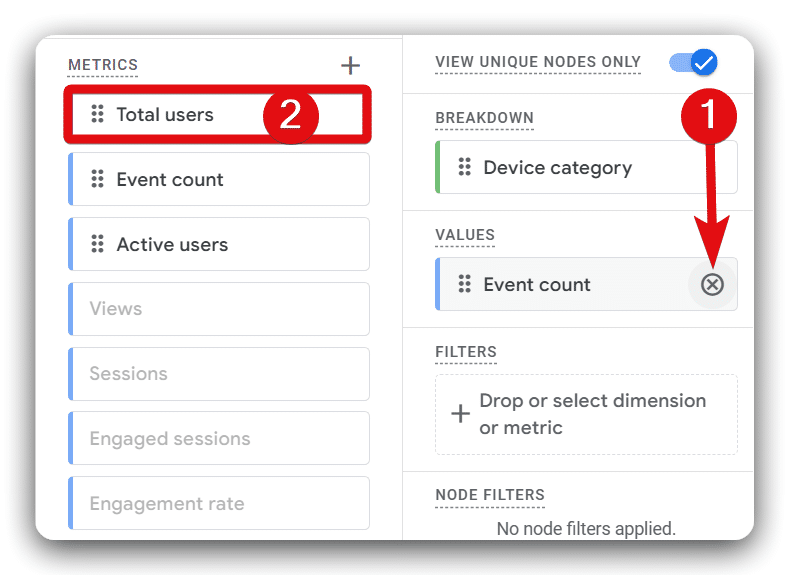
Replace the existing ‘Event Count‘ metric with ‘Total users‘.
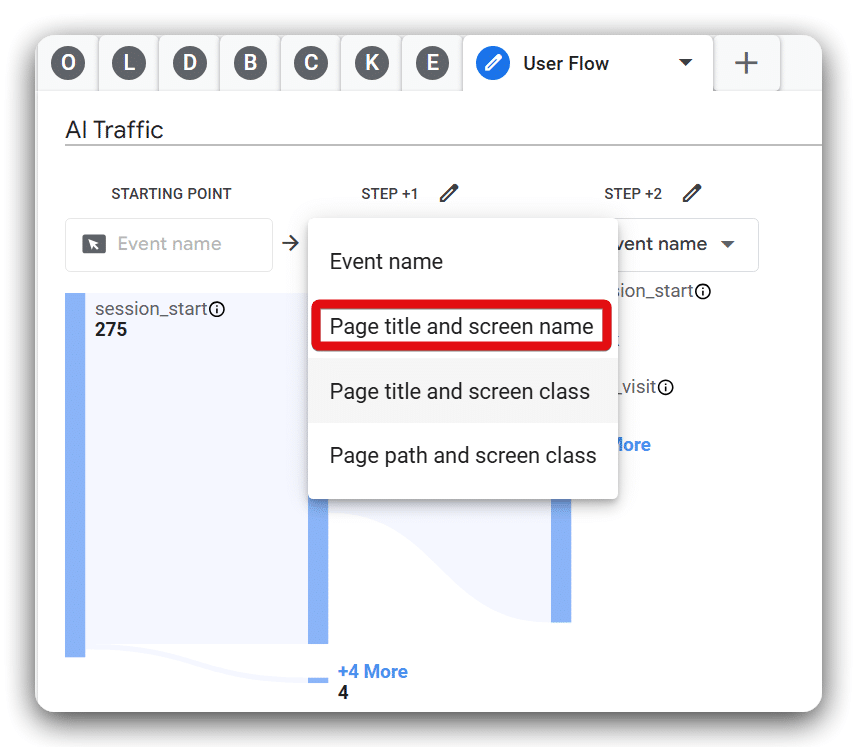
Now click on the drop-down menu under ‘STEP +1′ and choose ‘Page title and screen name‘ from the list.
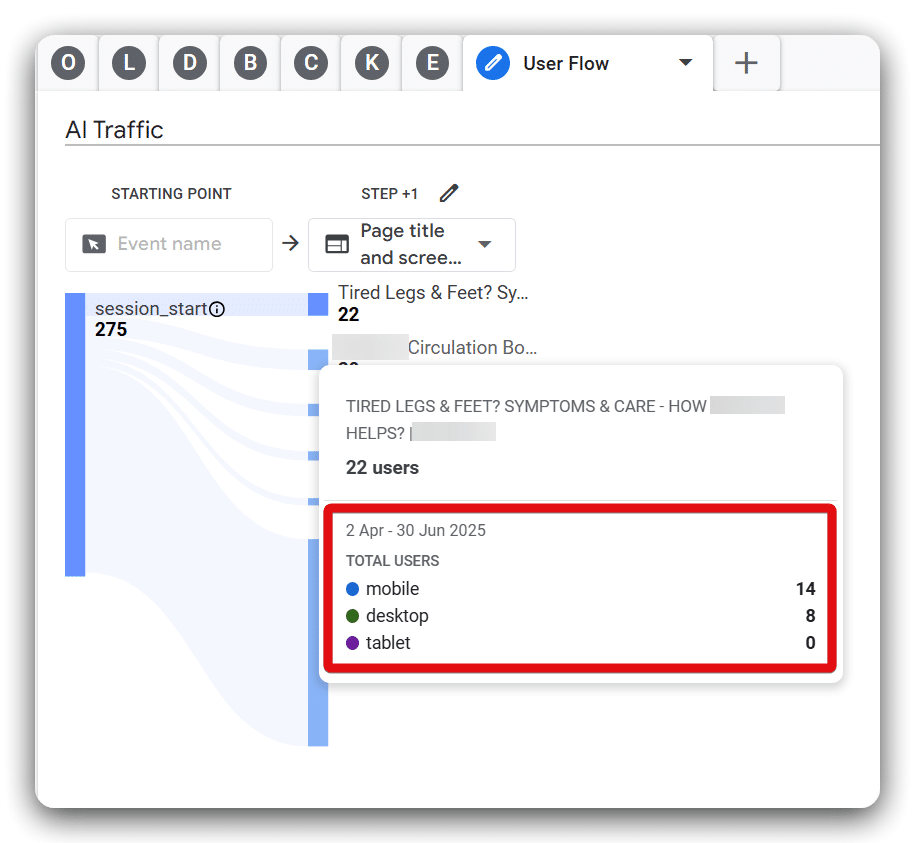
Explore the flow by hovering over the bars, which will show breakdowns by device category.
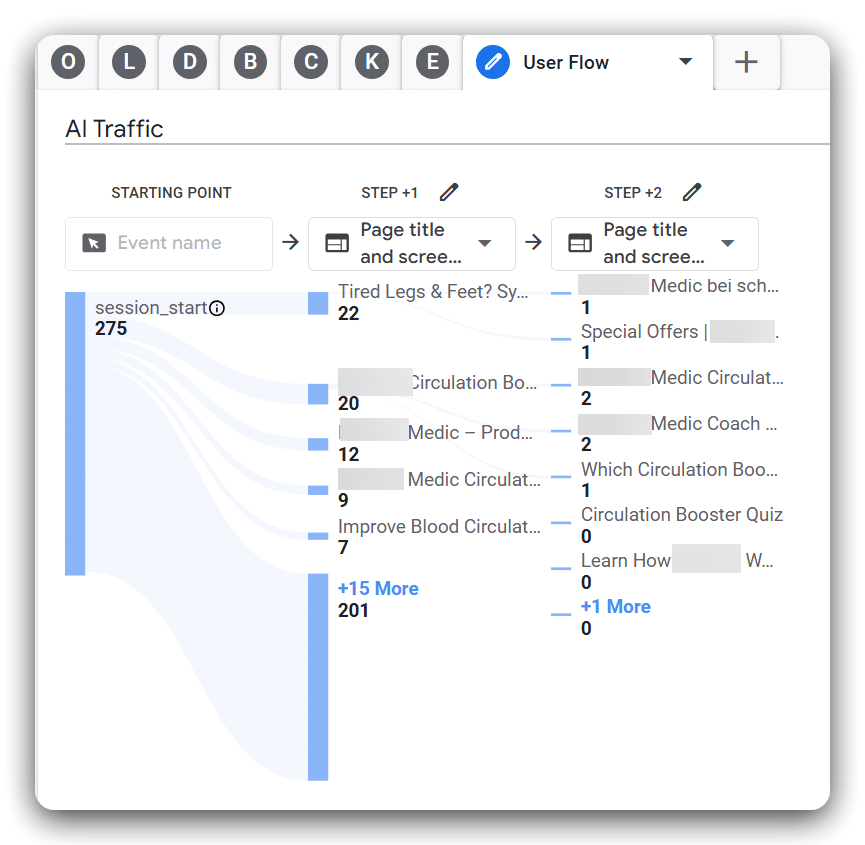
Once you click on any blue bar in this report, another step will be added, showing the progression from the last page. These blue bars can help you see how organic search traffic is using your website.
Report 9: Setting up the ‘Funnel’ report
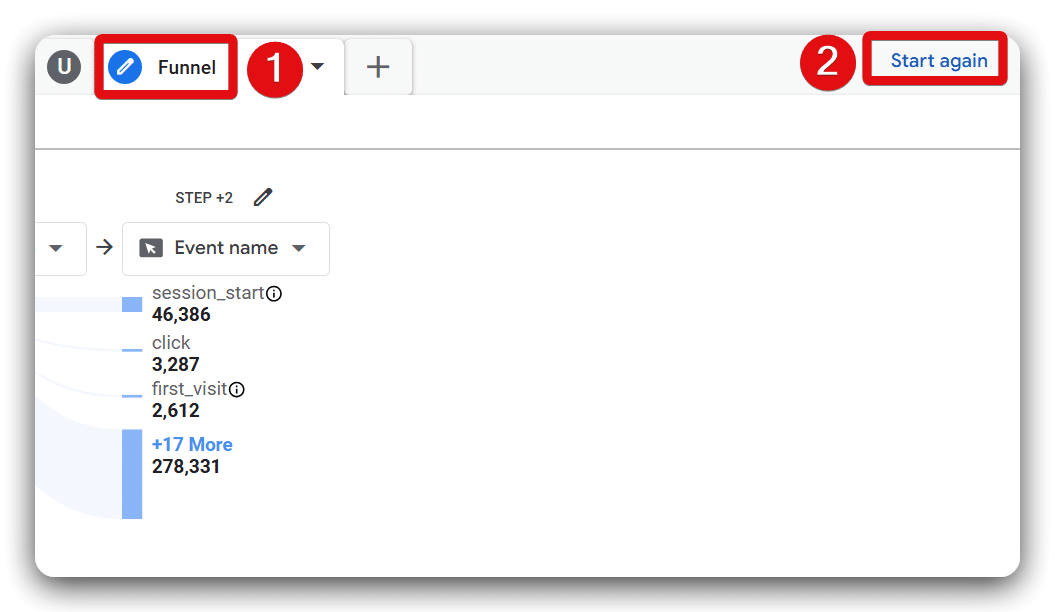
Create another ‘Path exploration‘ tab beside ‘User Flow‘ and rename it as ‘Funnel‘. Then, Click ‘Start again‘ to reset the report.
Now, apply the ‘AI Traffic‘ segment from the segment section. Then, include the ‘Device category‘ dimension as a breakdown dimension to the report.
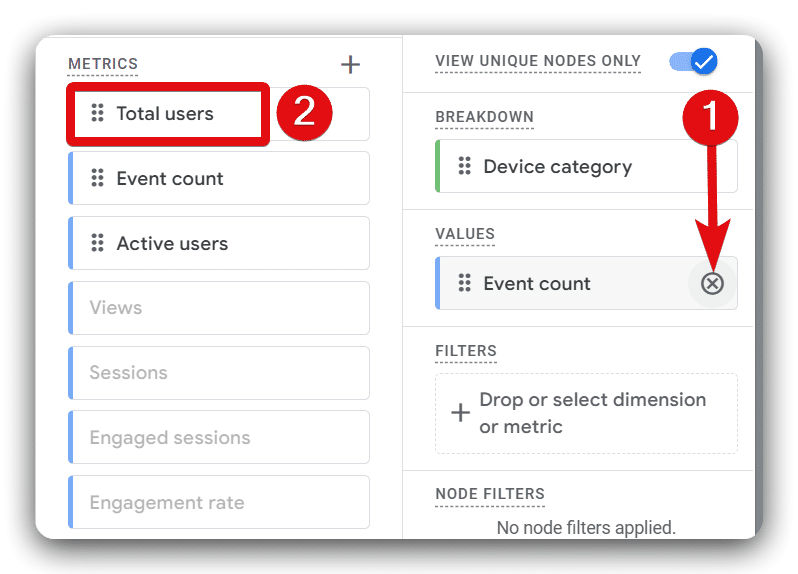
Remove the ‘Event count‘ metric from the values section and replace it with ‘Total users‘.
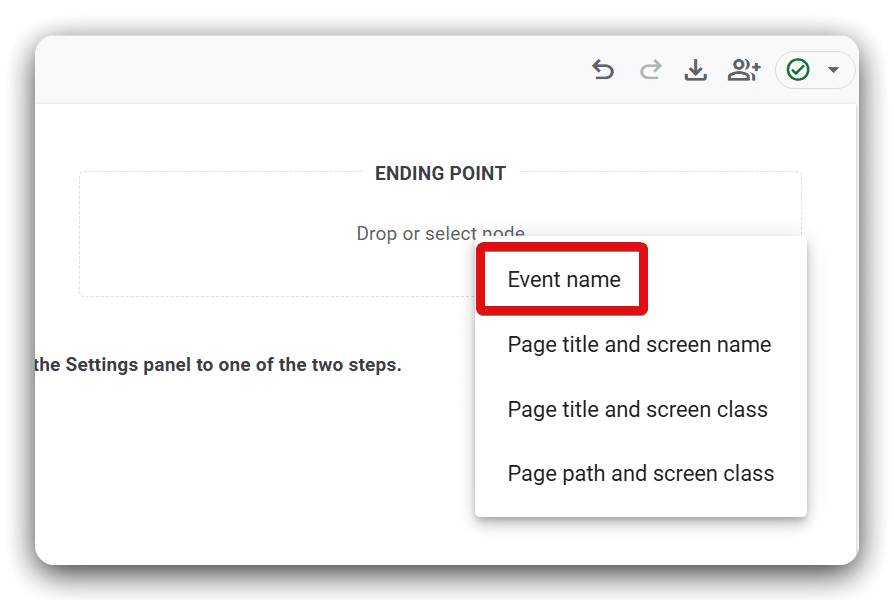
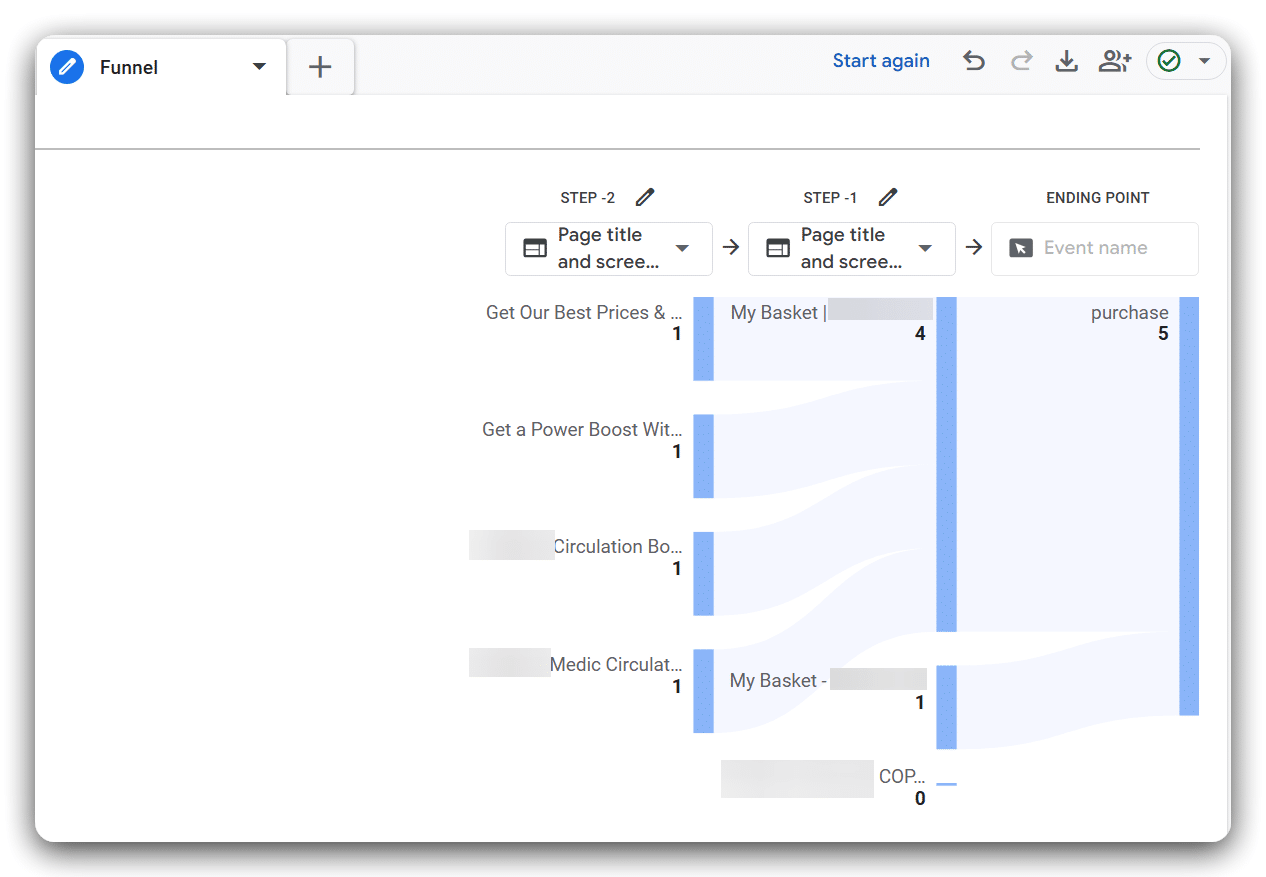
Select ‘Event name‘ node type as the ending point.
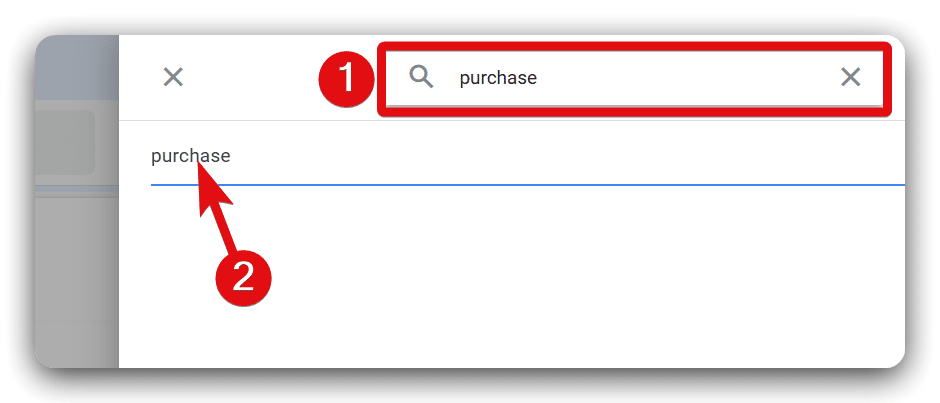
Use the search function to select a conversion event; in this case, we’re selecting ‘Purchase.’
Set the ‘STEP +1’ to ‘Page title and screen name‘ option.
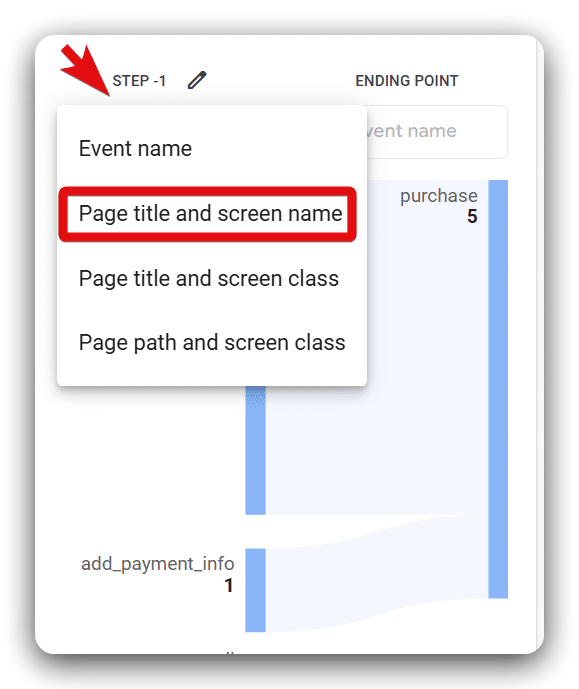
Click on any bar from the ‘STEP +1’ to generate the step. Continue building the funnel by clicking on each step’s subsequent bars to analyse user paths. If you look at different conversion pathways taken by AI-driven traffic on your website, you’ll get a sense of how your AI-driven traffic is converting.
Conclusion
AI chatbots imitate human users, creating traffic that’s easily mistaken for real visitors. These visits often exhibit unusual patterns, such as long session durations, rapid page browsing, and unexpected navigation routes. You can use tools like GA4 and BigQuery to understand your user journey, which will help you identify AI-generated traffic.
Although AI traffic seems highly engaged, it rarely leads to conversions, negatively affecting marketing strategies. Businesses can address this by utilising professional SEO services, such as those offered by MeasureMinds, to improve analytics and increase genuine search marketing results.

Thank you for such an in-depth article on AI traffic in Google Analytics, that includes the report setup too.
Thanks for your encouragement! We’ll continue to provide value to the web analytics community.