Google Analytics 4 Benchmarking: Compare Your Site with Peer Groups

Knowing how well your website performs compared to your competitors has always been the holy grail of marketing. The new Google Analytics 4 benchmarking feature helps you do just that. It offers more than just standard digital marketing analytics. You can uncover valuable business insights by comparing your GA4 data with industry benchmarks and selected peer groups. And that makes it a great addition to the existing GA4 features.
Understanding Google Analytics 4 benchmarking
With GA4 benchmarking, you can compare your site’s performance with aggregated and anonymous data from websites across various industries. These benchmarks serve as reference metrics that reveal how your business stacks up against industry standards.
By understanding where your website excels or falls short compared to similar businesses, you can identify both strengths and areas needing improvement. This data-driven perspective helps adjust your digital marketing strategies, allowing you to take targeted actions to improve your website’s performance and drive better results.
Key features of GA4 benchmarking
Here are some of the key GA4 benchmarking features that make it a great addition:
Industry peer comparisons
Compare your performance with similar businesses within your industry. Peer groups are formed based on industry categories, ensuring accurate comparisons.
Benchmark percentiles
GA4 offers benchmarks across percentiles (peer median, 25th, 75th) to show how you compare with other businesses in various performance tiers.
Daily data updates
Benchmarking data is refreshed every 24 hours, giving you access to up-to-date comparisons for timely strategy adjustments.
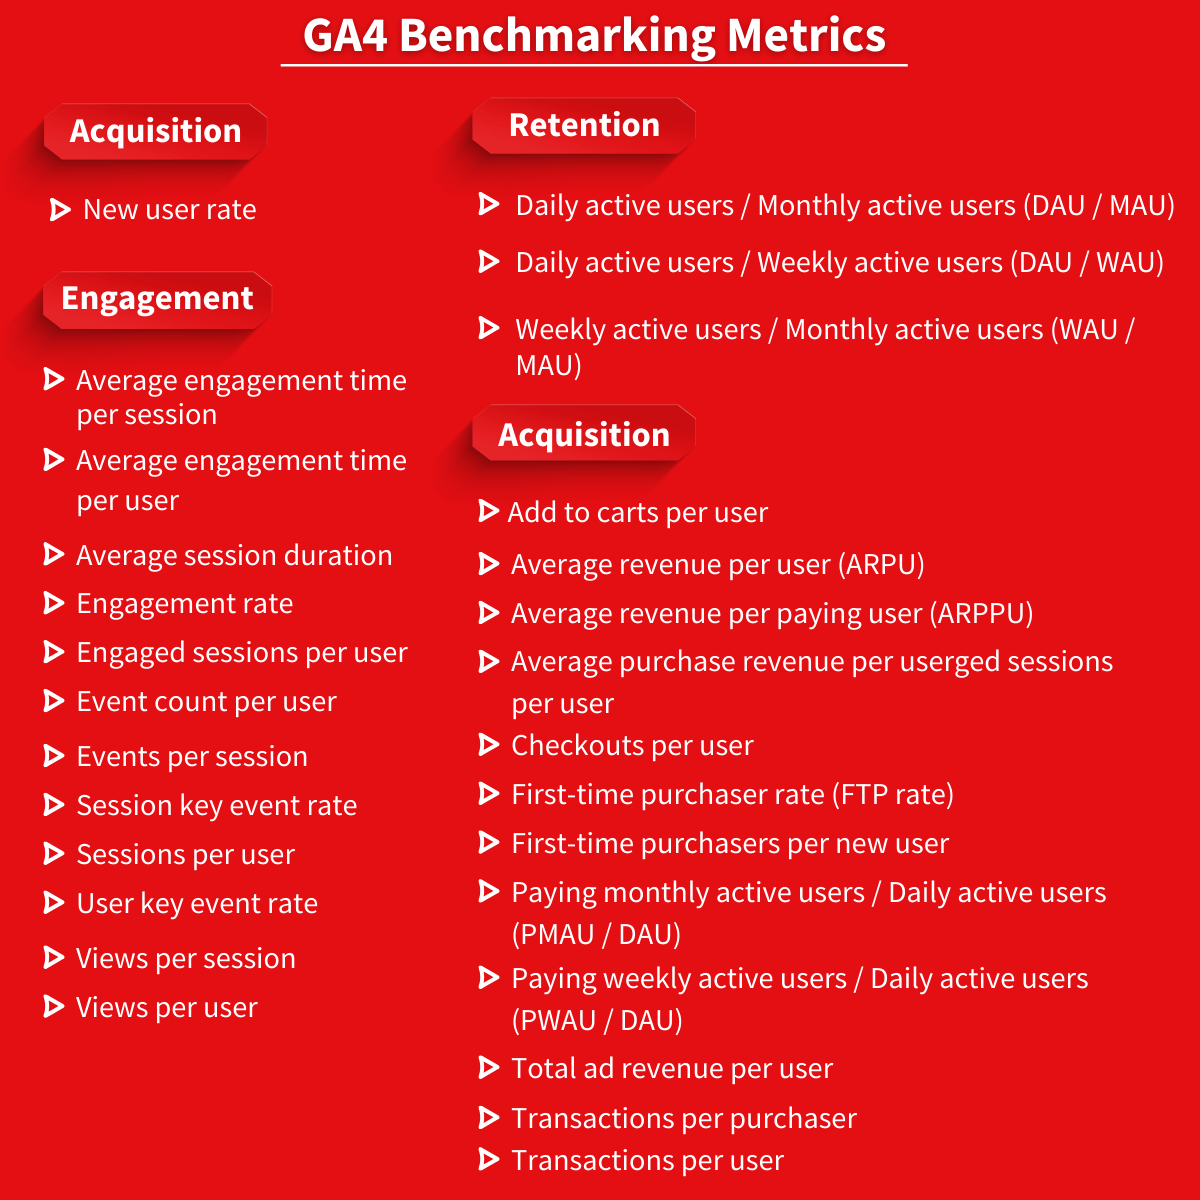
Holistic metrics coverage
GA4 offers benchmarking for a wide range of metrics, enabling businesses to evaluate their performance at different stages of growth:
- Acquisition: New user rate
- Engagement: Average engagement time per session, Engagement rate, etc.
- Retention: Bounce rate, Daily active users/Monthly active users (DAU/MAU), etc.
- Monetization: Add to carts per user, Average revenue per user (ARPU), etc.
Data privacy and protection
Your data remains private and encrypted. Only aggregated insights are shared, and thresholds are in place to ensure reliable, high-quality data comparisons.
What do peer groups in GA4 mean?
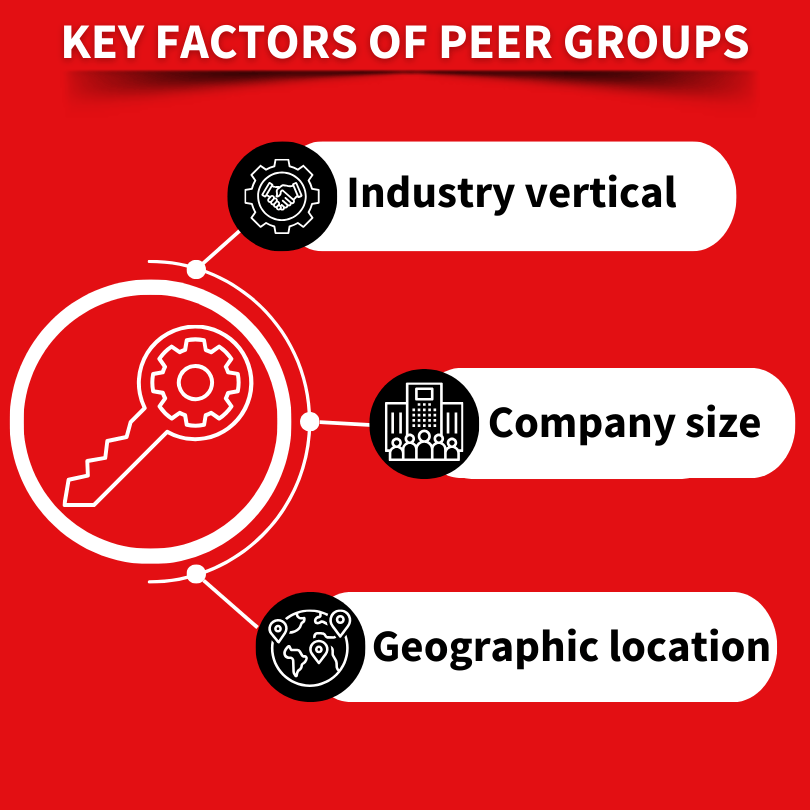
Peer groups in GA4 enable businesses to benchmark their performance by comparing it with industry-specific data from similar organisations. Peer groups have been formed based on several factors, such as:
- Industry vertical: Ensuring your comparisons reflect businesses operating in the same space.
- Company size: Allowing insights to be more meaningful by comparing against businesses of similar size.
- Geographic location: Helping to account for regional factors that might influence performance.
By benchmarking against these groups, businesses can uncover strengths, weaknesses, and opportunities for improvement & future growth.
Importance of comparing sites with peer groups
Comparing your website’s performance to those of others in your industry can help you gain a new perspective on your growth strategies. Understanding how you compare to competitors makes finding room for improvement easier than ever. This data lets you use resources wisely and focus on improvements that can lead to actual results.
GA4 lets you choose a peer group that fits your business. You need to consider factors like industry, size, and geographic location. This personalised peer group can give you clearer pointers on what you should focus on to bring tangible growth to your business.
Setting up benchmarking in GA4
Using GA4’s benchmarking features is easy and can quickly benefit your digital marketing efforts. First, log into your GA4 account and follow along.
Prerequisites for using benchmarking metrics
Before you start with GA4 benchmarking, make sure you have an active GA4 property that tracks your website’s data.
To be eligible for benchmarking data in Google Analytics, your property must have the Modeling contributions & business insights tickbox checked. You can find this setting in Admin > Account > Account details.
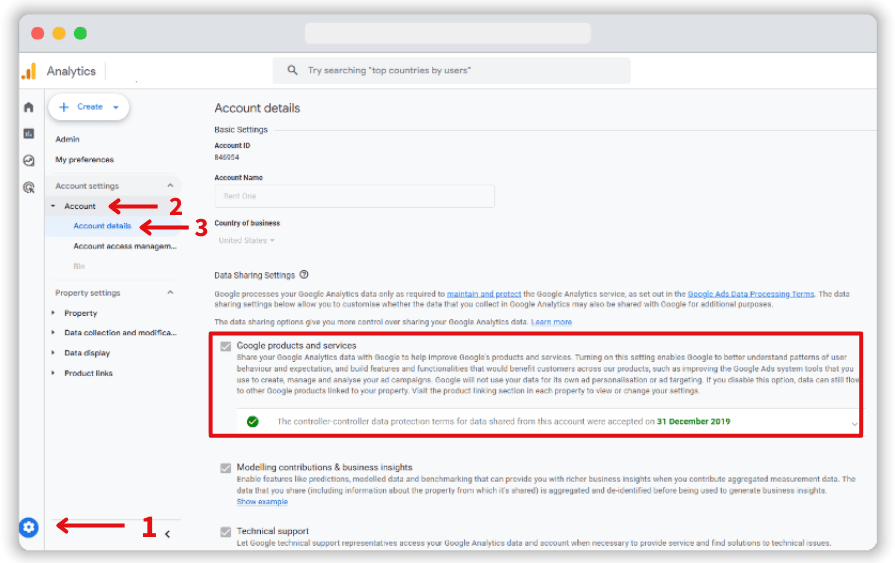
Once this setting is enabled, you’ll gain access to powerful benchmarking insights that allow you to compare your business’s performance against industry standards.
Note: It might take up to 48 hours for benchmarking data to become available after enabling it.
How to access Google Analytics 4 benchmarking metrics
To access benchmarking data in Google Analytics 4, follow these steps:
Navigate to the Home section of your G44 account’s dashboard.
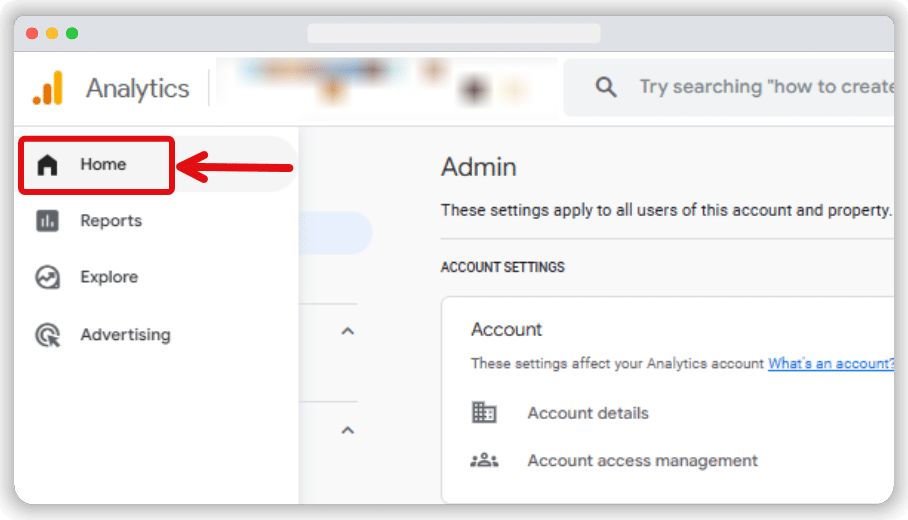
In the Overview card, locate and click on the metric you wish to change, which will bring up a drop-down menu.
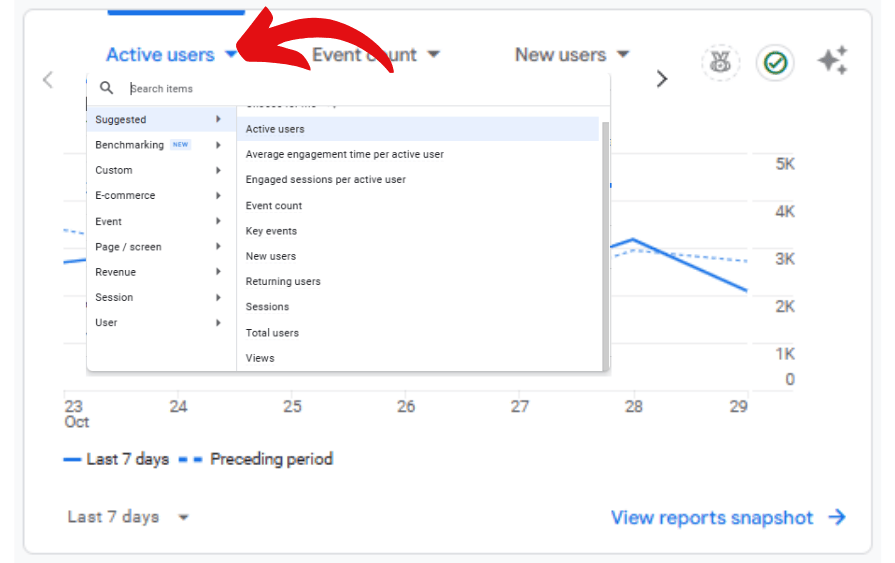
Expand the Benchmarking category from the available options.
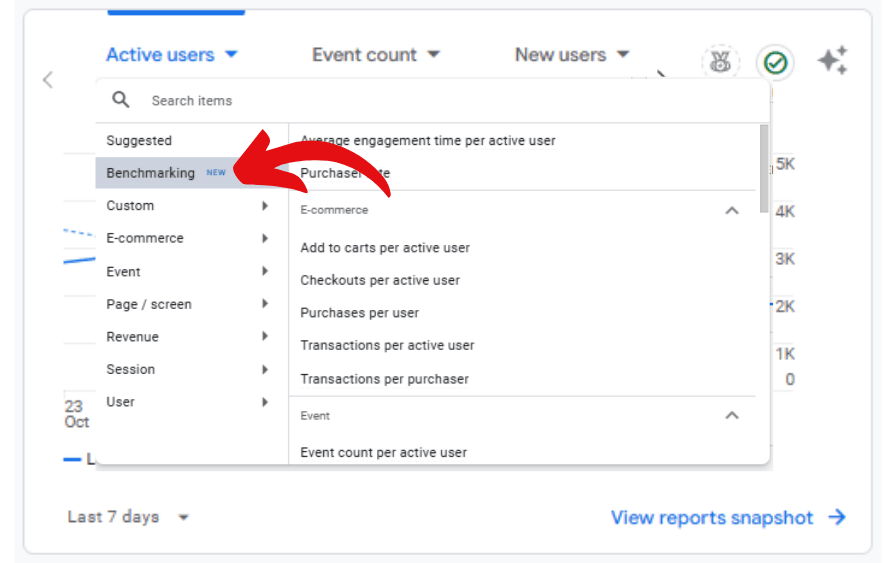
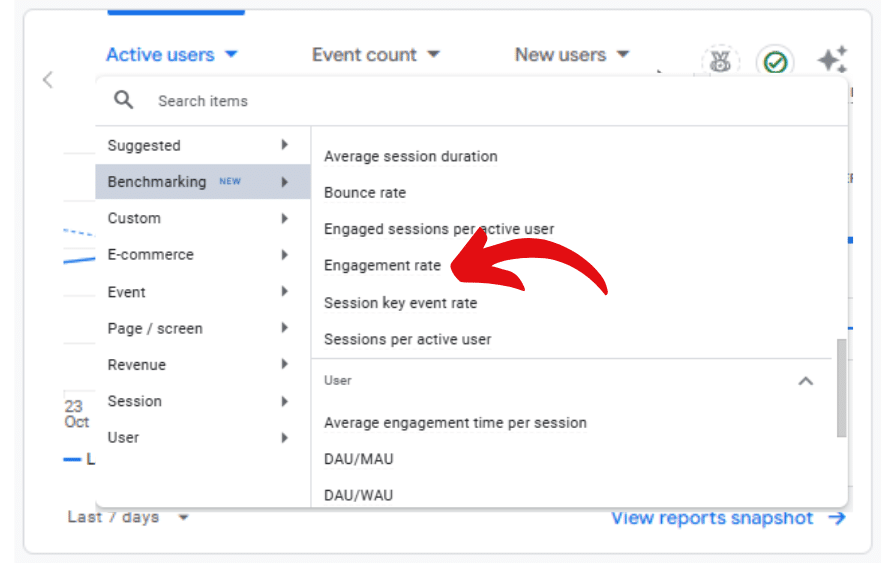
Choose one of the metrics for which you want to view benchmarking data. In this case, we are selecting “Engagement rate” as the metric we want to check.
How to enable GA4 benchmarking data
To check if benchmarking data is enabled for the current metric, look for the benchmarking badge at the top right corner of the Overview card. If it’s active, you will see the word “On” next to the badge.
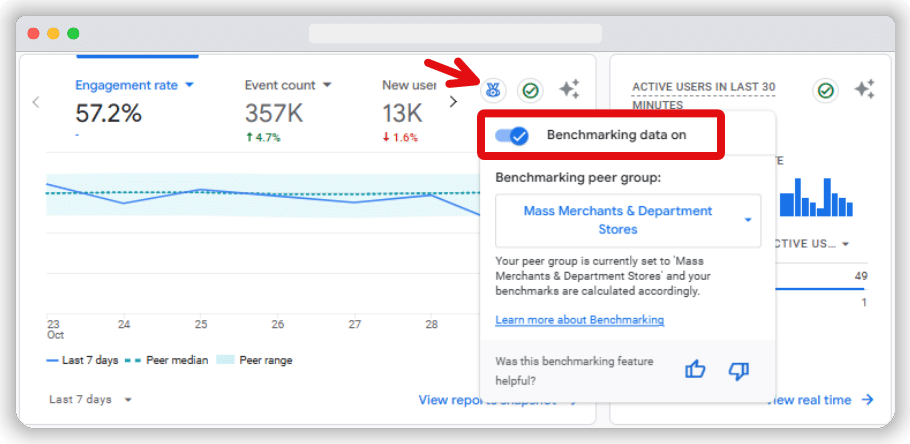
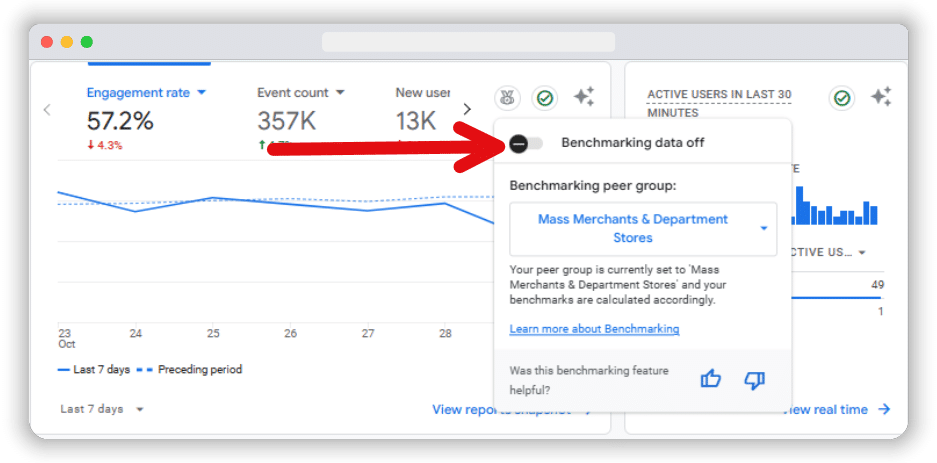
When benchmarking is turned on, relevant benchmark data for any applicable metrics will appear in the Overview card. You can easily turn off the benchmarking feature by clicking the toggle button from the badge section.
How to understand GA4 benchmarking data?
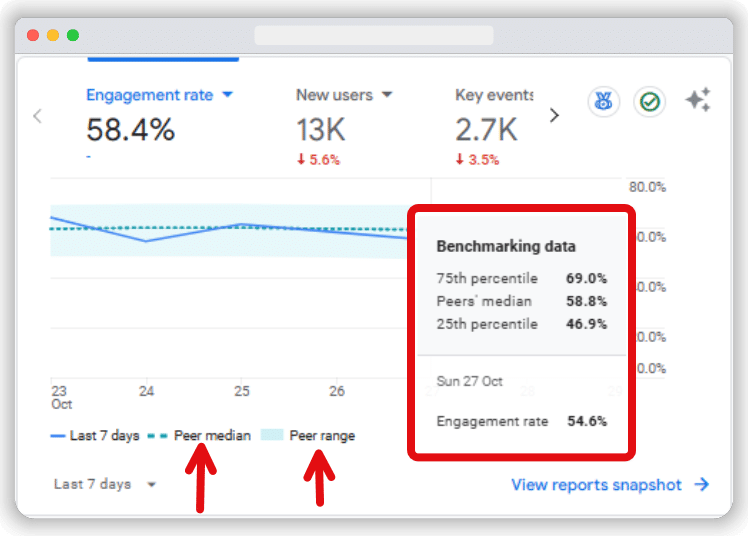
Once benchmarking data is activated, you can view detailed visualizations within the Overview card that help you understand your performance at a glance:
- Your property’s trendline (solid line): Represents your business’s performance over time, allowing you to track your metrics.
- Median in your peer group (dotted line): Displays the median performance of similar businesses, giving you a reference point to understand where you stand in relation to others.
- Range in your peer group (shaded area): Illustrates the range of performance across your peer group, helping you identify whether you fall within the typical performance band.
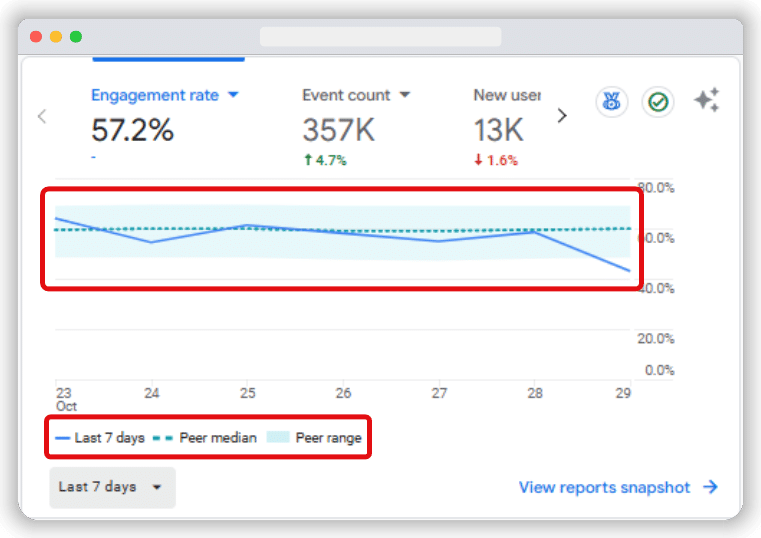
Benchmarking data in GA4 is shown within the 25th to 75th percentile range, helping you understand how your website stacks up against industry averages.
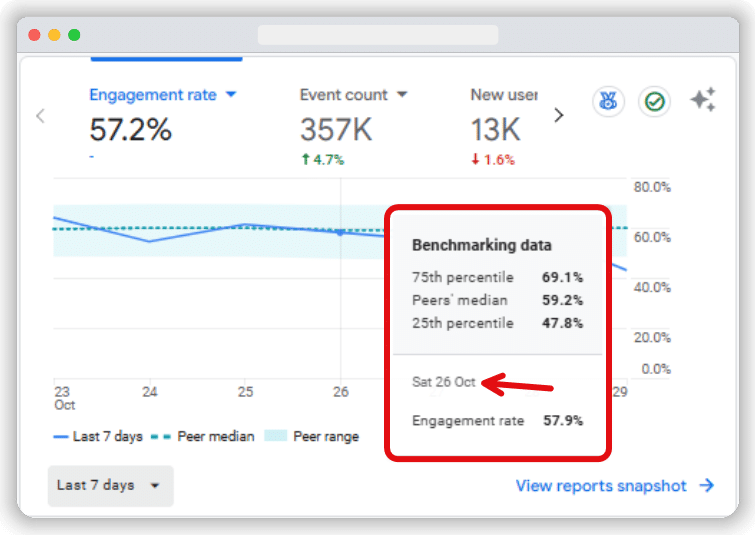
You can hover over the trendline to see specific data points for a particular day, giving you a deeper understanding of your metrics.
Note: Remember that benchmarking data won’t be available if the date range is set to ‘today.’ It is available starting from May 30, 2024.
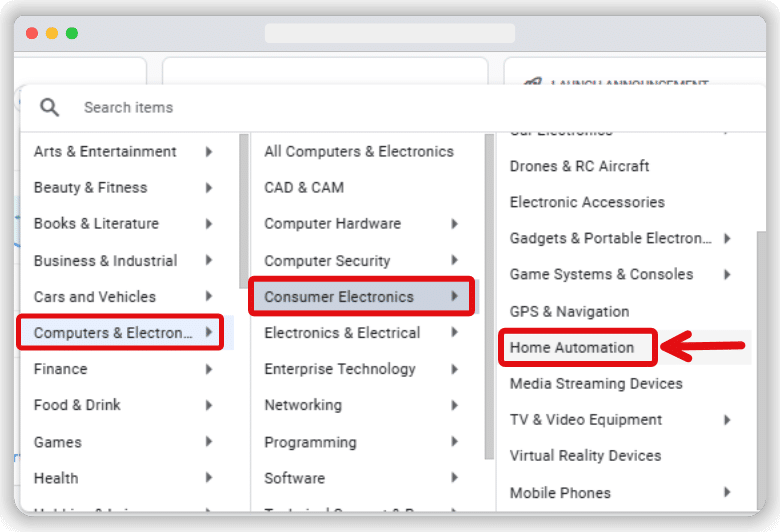
How to change peer groups
As mentioned earlier, peer groups in GA4 consist of businesses that share similar characteristics, allowing you to make more meaningful comparisons. For example, if your business sells home automation products, you would select the Computers & Electronics > Consumer Electronics > Home Automation peer group. This ensures you will benchmark against companies offering similar products in the same industry.
Here are the steps to modify your peer group:
Locate the Benchmarking peer group section by expanding the benchmarking data badge in the Overview card.
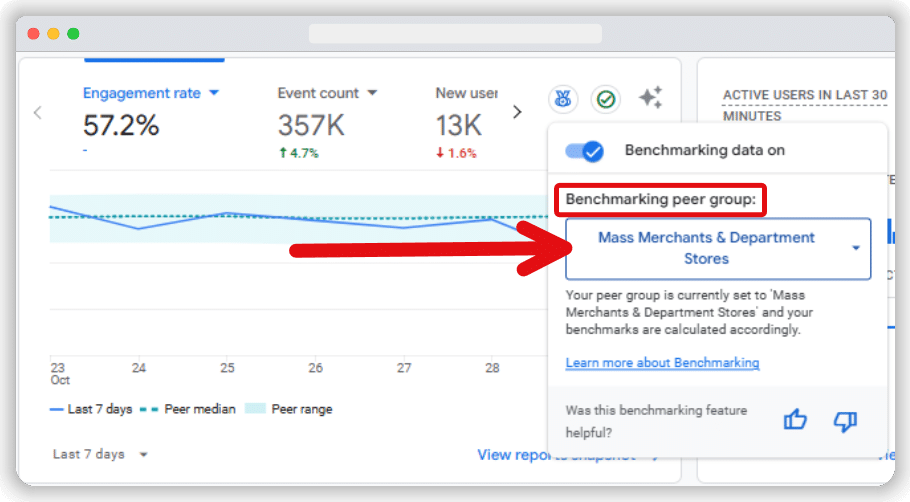
From the drop-down menu, find your desired Group & click on it to change your peer group.
Your initial peer group is automatically assigned based on the industry category you selected during setup and attributes like the default URL and app ID specified in your property’s data streams. Adjusting the peer group allows you to fine-tune the comparison data, making it as relevant as possible for your business.
How to use GA4 benchmarking data
By understanding where your business stands relative to your industry peers, you can identify areas for improvement and capitalise on your strengths. Let’s discuss some GA4 benchmarking metrics:
Boosting user acquisition
If your New User Rate falls below the 25th percentile compared to similar businesses, it could be a sign that your user acquisition strategies need improvement. Consider investing more in targeted advertising, enhancing your SEO efforts, or launching a content marketing campaign to drive more qualified traffic to your site.
Capitalising on high engagement
If your Average Engagement Time per Session is higher than the 75th percentile, it indicates strong interest in your content. This is an opportunity to focus on increasing conversions to the pages that bring in the highest average engagement time. For example, we can add clear CTAs, offer personalised promotions, or suggest related products and services to turn engagement into sales.
Reducing bounce rate
If your Bounce Rate is higher than the median of your peer group, it could indicate issues with user experience or content relevance. Improving the relevance of your content, optimising page load speed, or simplifying navigation to reduce cognitive load can lower the bounce rate and keep users engaged.
Increasing monetisation metrics
If your Average Revenue per User (ARPU) lags behind your peers, it might be time to revisit your monetization strategy. Consider implementing upselling techniques, offering bundle discounts, or creating loyalty programs to increase the value each customer brings to your business.
Frequently asked questions
What are the prerequisites for enabling benchmarking in GA4?
You need an active Google Analytics account with an active GA4 property. Ensure the “Modelling contributions & business insights” setting is turned on in your account settings.
Can I change my peer group after the initial setup?
Yes, you can change your peer group from the Overview card in the Home section of the GA4 dashboard whenever you want. This is helpful if your business changes a lot. It also lets you compare your data with other businesses with similar traffic levels, especially after a new website launch.
Is benchmarking data in GA4 compliant with data privacy standards in the UK?
All brands should become data privacy compliant, given the surging fines. It follows the correct industry standards, especially those in the UK. Benchmarking data is aggregated, encrypted, and anonymised to protect user identities.
How often should I compare my site’s metrics with peers?
It’s a good idea to check benchmarking reports in GA4 regularly, ideally once a month or every three months. This helps you see trends in your industry. You can also measure how your marketing efforts are doing. Plus, if there are any performance problems, you can spot them early.
- How to Run a Google Tag Manager (GTM) Audit - 26/11/2025
- How to Run a Web Analytics Audit: Examples & Tools - 30/10/2025
- How to Run a Cookie Audit: Examples and Tools - 23/10/2025