How to Blend GA4 & UA Data Using BigQuery & Looker Studio

Looking to blend UA and GA4 Data using Looker Studio? Let’s explore how a continuous analytics bridge (CAB) can help you.
This article is a webinar write-up for the GA4ward talk by Siavash Kanani, Founder & CEO of Siavak Analytics. You can find his slides here and a recording of his talk below:
Changing products – Unhappy customers
Let’s begin by talking about tethered bottle caps. Several years ago, the EU introduced a law to improve recycling rates. The law stated that bottle caps must be attached to their bottles.
Unfortunately, the response on social media to this change wasn’t always positive. People were frustrated, feeling that drinks were more difficult to open. In short, they wanted the simple bottle cap to return.
At this point, you may be wondering why we’re talking about tethered bottle caps. Well, think for a moment about another product designed to solve a problem people didn’t have. Again, people are unhappy about the change; they want the old version of the product back.
We’re talking of course, about Google Analytics 4. GA4 turned our smooth sailing into a stormy sea. It’s probably the next big thing, but right now, the tool is causing a lot of headaches.
While the tools change, the businesses don’t. Businesses are still tracking metrics, KPIs, and interactions in the same way as before GA4. The tool wasn’t something that we asked for, but something we needed to adapt to.
The challenges of migration
Unfortunately, there are several challenges in mapping our UA implementation to GA4. Understandably, people have many questions. We’ve listed some of these below, as well as solutions that people have been utilising.
- What happens to what we tracked in UA? – We need to backup to ensure we keep our UA data.
- Why can’t we get the same reports from the GA4 interface? – We can recreate most of our reports within Looker Studio.
- Why can’t all my reports be recreated in Looker Studio? – To get these reports we need to go to the BigQuery export table.
- What if I forgot to enable export? – Some third-party companies created solutions to backfill GA4 data into BigQuery.
- How can I handle the cost of querying the GA4 export table? – The cost can be reduced with data form and creating sampling tables in BigQuery.
- Why is my recent GA4 export data changing? – We need rolling workflows in BigQuery to reprocess and rewrite data for the past 3-5 days. This ensures it matches the GA4 interface.
- How do I get real-time reports in GA4? – We can use the intraday table in BigQuery.
The UA to GA4 data transition chaos
We faced many problems transitioning from UA to GA4. We experienced data fragmentation issues, which resulted in the loss of much of our historical data. Mapping schemas was challenging; what are the equivalent metrics from both platforms?
We suffered from delayed reports, hindering our ability to make timely decisions. Lastly, we struggled with data retention limits of 2-14 months. This hampered our ability to carry out long-term analysis and planning.
The data continuity challenge: From day zero UA to real-time GA4
Siavak created a solution known as a continuous analytics bridge (CAB). This helped clients create a continuous schema from day one of UA to real-time in GA4. Siavak’s solution has seven aims:
- Preserve historical UA data to ensure it isn’t lost during the transition.
- Use GA4 with BigQuery to backfill the gaps of what’s missed.
- Perform analysis on BigQuery export cost-efficiently and at scale
- Match the schema between two systems
- Handle changes to recent day’s data
- Enable real-time analysis: Provide instantaneous insights without delays.
- Offer a unified view: Combine data from all these sources into a single, coherent dataset.
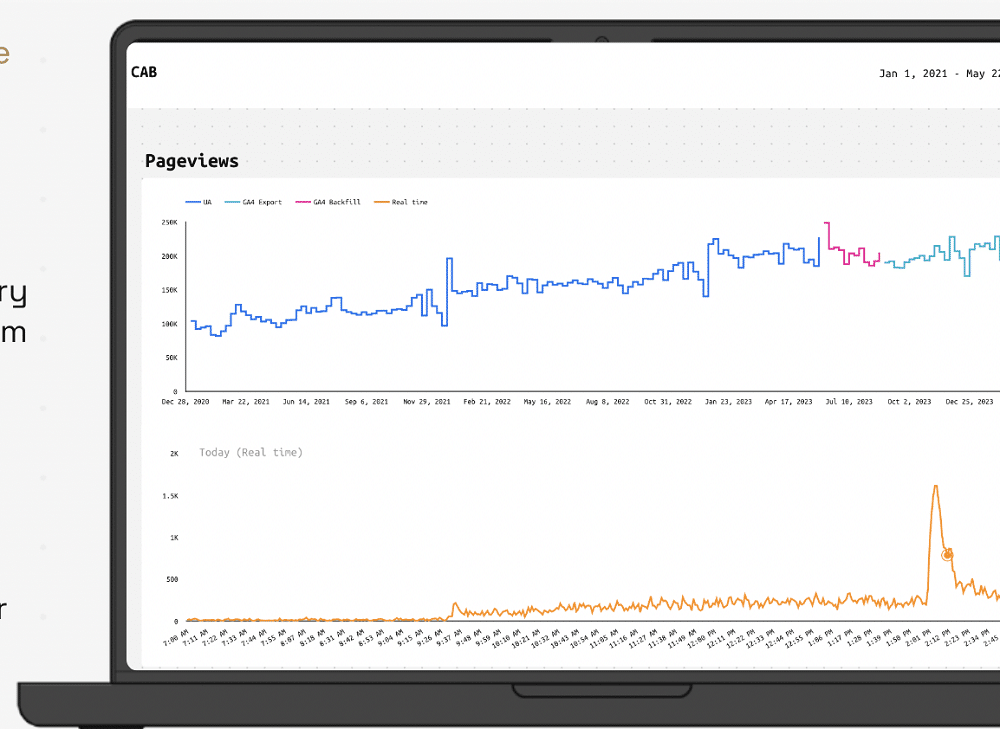
The image below shows CAB in action. We can see the big-picture analysis from UA in 2020 showing the ‘pageviews’ metric. We can look at any metric that we’d like and get a similar analysis.
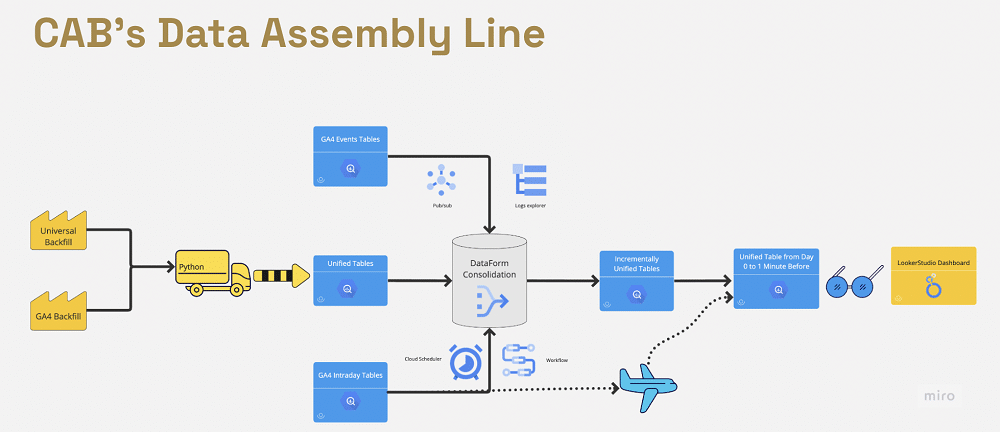
The CAB solution
Components
Siavak needed to extract data from UA and GA4 (for users who forgot to enable the export). For this, there were two open-source solutions. They could backup Universal Analytics to BigQuery, and also backfill GA4 to BigQuery
After extraction, they can map data between the two platforms (e.g., sessions to sessions, bounce rate to bounce rate, etc.).
Both platforms are integrated into a single table before being transformed within BigQuery. Transformation follows the same schema as extracting data from the GA4 and UA API. Keeping the same schema allows Siavak to consolidate the different sources together.
Finally, they could attach real-time data using two different methods (we’ll talk about these later). We can then blend UA and GA4 Data using Looker Studio to produce visualisations.
Challenges and solutions
Siavak faced several challenges when implementing CAB. These included:
Data extraction and preparation
Utilising open-source solutions presents some potential problems. To avoid these, Siavak had to account for the following areas
- Ensuring that they provided a clear definition of dimensions and metrics.
- Making sure that the data was accurate and complete.
- Implementing redundancy checks ensures no data is missed during the backup process.
- Utilising various techniques to minimise the impact of GA quotas and API limits.
Metric mapping: GA4 vs UA
When there are equivalent metrics (bounce rate, sessions, etc), mapping from UA to GA4 is very easy. When there is no equivalent, however, the process becomes more difficult. In these instances, we must create a custom mapping between UA and GA4.
Siavak also needed to ensure that data types were correct. Sometimes events in UA are strings whereas in GA4 they are numbers (or vice-versa). On the face of it, data seems to be the same but is actually in different formats.
Preventing limit exceedances
The core reporting API and data API V.1. can return up to 100,000 rows per request, depending on the number of dimension segments, and 10,000 requests per view per day.
To avoid exceeding the limit, Siavak took two steps:
- Token-based requests: Managing new API requests within page size limits to avoid rate limit issues.
- Dynamic page size management: Balances data volume and API call limits for efficient data extraction.
Scalable and efficient pipeline management
For some Siavak clients, the process involved dealing with hundreds of accounts simultaneously. Each was high volume and shared the same schema and setup. These accounts needed to be extracted from UA to GA4 similarly.
Siavak had to answer the question, ‘How can CAB perform at scale and run pipelines for multiple views efficiently?’ The company came up with two solutions:
- Centralized configurations: Uses a central configuration to manage settings for multiple data views. This allows Siavak to automate pulling from hundreds and thousands of views and properties at the same time.
- Modular script design: A modular approach to script design allowed the company to apply individual customisation based on each account/client’s requirements (i.e. custom dimensions, metrics, and mapping of GA4 implementation).
Efficient Data Integration and Storage
Siavak had to create a ‘service account’. This sits in BigQuery and can access both UA and the GA4 property. It also has access to BigQuery and Google Cloud resources to perform the operation.
When using the service account, the company didn’t need to go through open authentication or renew authentication. This is why it could extract so many accounts at the same time.
During the extract, the company used partitioning for cost-efficiency purposes. It also customised schemas for the unique needs of each company.
Transforming and consolidating data
Siavak prefers the unsampled native schema in BigQuery. This is because it doesn’t have the data retention limits and can be more accurate.
The company usually uses official definitions of metrics. For some instances, such as user count, the GA4 interface uses hyperloglog for efficiency. When we have access to the BigQuery export table, however, we can use count distinct, which is more accurate.
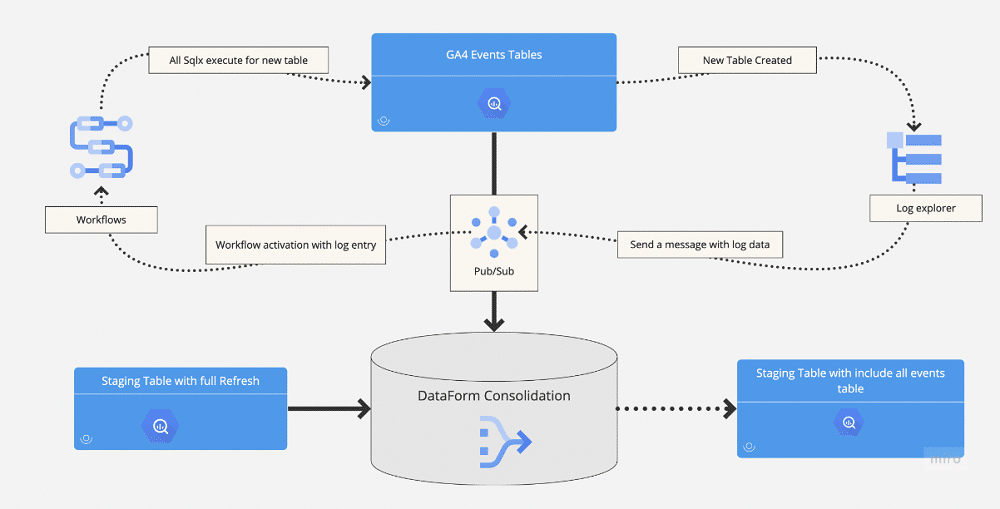
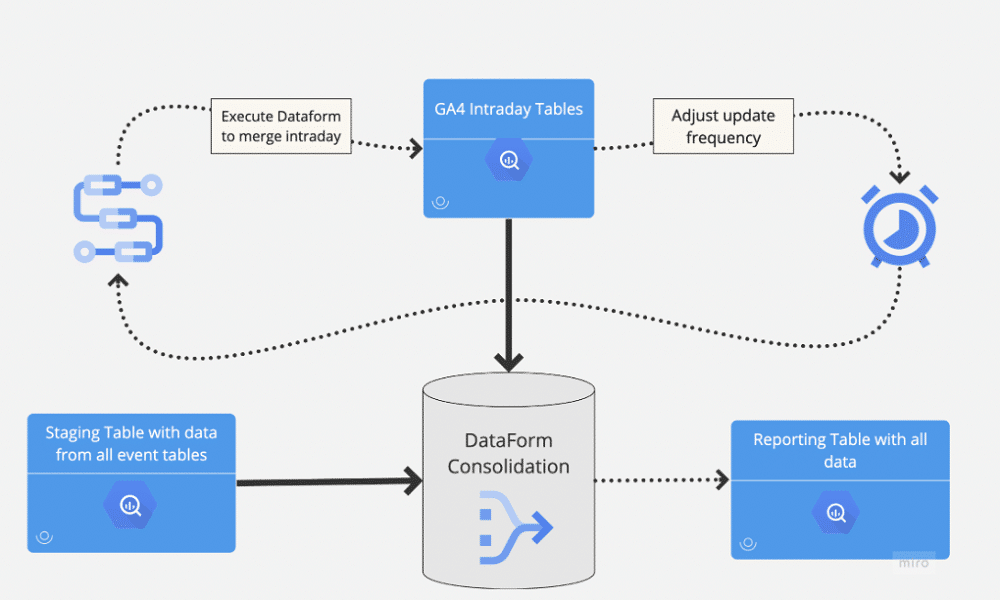
Incrementally update with events table
We needed to create a cost-effective extraction method that would only detect and replace tables where the date had changed. The log explorer in Google Cloud enabled them to do this.
Log Explorer sends a message containing big data to Pub/Sub. This processes the log, and looks at the table to find any date changes. This is then reprocessed within Workflows and appended to the GA4 events table.
Real-time data ingestion
The company had two ways of handling real-time data ingestion. It could have been handled on an hourly basis, once the daily tables were complete. Or, they could recreate the same processing using a view in BigQuery, which is unified and appended to their existing data.
When Looker Studio queries the view, the company can be sure that all events in the intraday tables are being processed in the same way as BigQuery. This approach is more costly but allows the company to receive up-to-the-minute data in its tables.
Minimising cost, maximising efficiency
CAB was built with cost in mind. Below are some of the steps Sivak has taken to reduce cost.
- Backfills from Universal Analytics to BigQuery and GA4 are almost cost-free in Google Cloud.
- Dataform and GCP tools used in CAB are mostly free.
- The initial setup costs remain minimal for most properties.
- Incremental updates are orchestrated via Dataform to minimise ongoing processing volume.
- Incremental methods keep costs low—often under $2 per month for up to 10 million events.
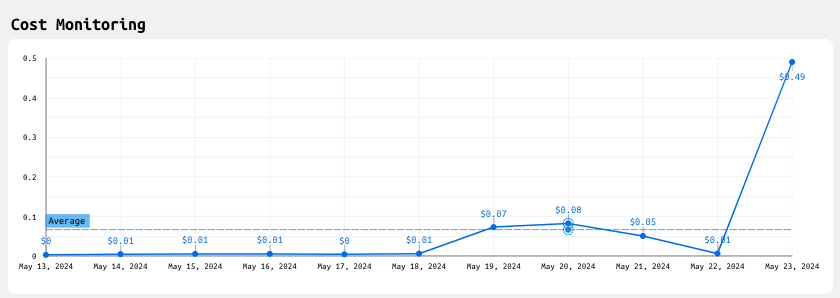
Keeping tabs on ride costs
CAB reports allow users to track expenses easily. The example below is from an actual user account and shows a sudden change in expenses. These dashboards can alert users if the CAB is becoming costly.
CAB vs alternatives
The table below helps compare CAB’s advantages compared to other platforms.
| CAB | GA4 interface | Third-party solutions | Open-source solutions | |
|---|---|---|---|---|
| Real-time reporting | Provides up-to-the-minute data for timely insights | Limited real-time reporting, with delays in data processing | Focused on historical data, lacking in real-time reporting capabilities | No support for real-time data capture |
| Reporting and data visualisation | Blend UA and GA4 Data using Looker Studio for customisable and interactive dashboards | Basic reporting features with limited customisation | Limited reporting capabilities, often requiring additional tools | No built-in reporting features |
| Scalability and cost-efficiency | Automated, scalable, and cost-effective with minimal manual intervention and maintenance | Limited, without significant additional setup | Expensive for large-scale backups and reporting | DIY scripts and manual processes can be time-consuming. Need technical experts, and can be costly to run |
| Ease of implementation | Done for you | Advanced setups have a steep learning curve | Often require technical expertise, challenging for | Require significant technical expertise to |
| none technical users | implement and manage |
What happens to CAB when UA is gone?
Whilst UA might be going, CAB can be used as a foundation to build upon. The tool processes data from GA4 and can bring cross-platform data, and process information on a real-time basis. It can expand its use cases going forward, going from a data engineering piece to a data analysis tool.
Want to see how CAB can blend UA and GA4 data? Why not try it for yourself, by clicking here?
About Siavash Kanani
Siavash is the founder and head of analytics at Siavak Analytics, a boutique analytics agency based in Budapest that helps ambitious online businesses leverage data to support strategic marketing and operational decision-making.
So far, Siavak has helped its clientele create systems and data pipelines using Google Marketing and Cloud Platform to collect, process, report, and analyze data for more than $4 Billion in combined revenue across online and offline channels.