GA4 Features | Top 16 Features of Google Analytics 4

Google Analytics 4 (GA4) is the latest version of Google’s flagship analytics software. There are a lot GA4 features that can substantially improve your organisation’s data collection.
This is a write-up of a combination of two webinars that we did. The first was from our founder, Phil Pearce, through our monthly digital analytics Meetup group. The second was from Julie Brade at our quarterly conferences, on this occasion being GA4ward. Sign up for our newsletter to stay in the know regarding our events.
Below are the recordings for ‘Top 10 Cool Things You Can do with GA4’, by Phil Pearce and ‘Top 3 Hidden Gems of GA4’, by Julie Brade. Subscribe to our YouTube channel, and don’t miss the others.
Here are the slides for Phil’s talk.
Here are the slides for Julie’s talk.
Jump to Julie’s insights to read her chosen top hidden features in GA4!
Top GA4 features you should use
Google Analytics 4 has so many features that it can be challenging to know where to start. We recommend experimenting with these new features to see how they could work for you.
1. Linking with BigQuery: One of GA4’s key features
Are you running a big organisation that handles lots of data? If so, you might also be dealing with the burdens of storage, maintenance, and security. You should definitely consider BigQuery (BQ), and its integration with GA4.
With BQ, you’re no longer having to handle any of these factors. Instead, Google provides the infrastructure and space to deal with your data. In effect, BQ is a fully managed data warehouse. The best news about BQ is that you can subsample up to 1 terabyte of data for free each month.
One of the best GA4 features is that it can be linked with BQ for free. This allows you to query your GA4 data alongside other data sources linked to BigQuery.
For example, we use BigQuery to integrate GA4 and Hubspot. This connects the dots between our data and, even better, allows us to avoid paying for Hubspot premium. This is because the Hubspot API is exposed for free. Cheeky! But cool!

Watch Out for Cardinality
If you’ve linked BQ with a previous version of GA, then this is an issue you might be familiar with. Cardinality occurs when your data contains too many URLs or parameters. In this situation, data is grouped under ‘other’. The size of your database is too long, and data is cut off after around 20,000 rows.
Frustratingly this issue is still present in GA4, but now cardinality is triggered slightly differently. Instead of occurring due to the number of rows, cardinality now happens when there are too many data variations. This can cause problems when analyzing CRM IDs when using a service such as HubSpot.
What to do about cardinality
The workaround for this issue isn’t ideal and is long-winded. Essentially, you’ll need two GA4 accounts; one sending CRM IDs, the other not. When storing CRM IDs it’s a good idea to setup Google Tag Manager Server Side to collect info from both GA4 accounts.
2. Set Up Hourly Insights with Email Alerts
This is a very interesting feature of GA4. Let’s imagine that for whatever reason, your website goes down. Your customers can’t access their accounts or find key information about your business.
Without alerts, it might take you a while to learn about this issue. During this time, your website users are getting more and more frustrated, and you’re potentially losing customers.
Email alerts have always existed within Google Analytics but until GA4 they were less frequent. You can set GA4 to alert you once every hour. With an hourly alert, you can know about any issue much more quickly. This means that you can get to work fixing errors.

3. Anomaly Detection Alerts
Sometimes, you might view data that differs significantly from traditional patterns. For example, this might occur if you recently ran an email campaign that triggered a spike in traffic on your site.
This data is generally viewed as being an outlier or ‘noise’. When this kind of deviation occurs, it is known as an anomaly. To collect the best data, you need a way of detecting anomalies.
Luckily, in addition to notifying you about outages, GA4 features ‘anomaly alerts’. GA4 uses multiple data inputs to determine the likelihood of data deviations resulting from an anomaly.
This is just one example of how GA4 uses machine learning to deliver more intelligent insights.

4. Activate Predictive Audiences to Better Understand Audience Behaviour
Wouldn’t it be great if you could track user behaviour and predict what they might do on your site? How are they behaving, and whether they are likely to make a purchase soon?
Google Analytics has always contained features to predict audience behaviour better. Universal Analytics, the older version of GA, contained a feature called Smart Lists. The software used machine learning to examine your conversion data. With this information, it could then determine how likely individual users were to make important interactions on your site utilising predictive metrics.
One of the best GA4 features is an improved Smart Lists system called predictive audiences. What exactly defines a predictive audience is up to you. For example, you might create an audience based on users who are likely to purchase in the next 7 days.
If you haven’t already, turning on predictive audiences today is a good idea. Once activated, you can start targeting high-value audience members who have yet to make a transaction.

5. New and Improved Funnel Analysis in GA4
Funnel analysis is an important part of optimizing your website and boosting sales. When a user is completing a desired action on your site (i.e., filling out a form) they will follow a series of steps known as a funnel.
Understanding user interactions during these steps is key to improving your website. Did some users drop off at a certain stage? Why, and what can you do to ensure that they stay?
In GA4 you get much more flexibility in your funnel tracking. Funnels that were previously only available to GA360 users with a $150K price tag are now available to standard GA4 users. Making this a really cool feature of GA4. Below are some examples of funnels that are essential for GA4 success:
- Open funnels
- Trended funnels
- Time-Based tracking in funnels
- What happens next?
- Advanced path analysis
- Audiences and funnels

6. Add Audience Triggers for When a User Qualifies for an Audience Segment
Audience triggers activate events when users complete key interactions on your site. You can decide exactly what triggers an event. What actions do you want your audience to complete? For example, you could set up an audience trigger after a user has read a certain number of articles.
This can help you to determine the success of your marketing. If events are being triggered frequently, good news – your users are carrying out important conversions. If not, your site might need some work.
This is one of the more interesting GA4 features because you could potentially trigger an overlay or another digital marketing campaign based on when certain people trigger events.

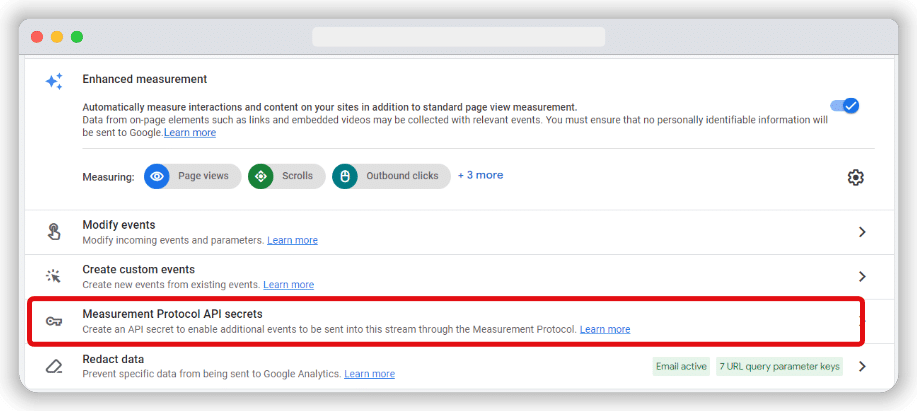
7. Enable Anti-Spam and Non-Human Activity with Measurement Protocol – a ‘Secret Key’
In Google Analytics 4, you can enable a ‘secret key’, measurement protocol that can be added to Google Tag Manager. This ga4 feature prevents spam from being picked up by your data stream.
8. Use Consent Mode for conversion upscaling
To address changing data privacy laws, including GDPR and the Digital Markets Act (EU) rapidly, Google introduced ‘Consent Mode,’ which essentially communicated consent choices, ‘accept’ or ‘reject’ to a website’s consent management platform (CMP). In November 2023, Google updated this feature to Consent Mode v2, which includes two new parameters for more precise consent management:
- ad_user_data: Consent for sending user data to Google for ads.
- ad_personalization: Consent for personalised advertising.
Consent mode adjusts Google tags based on visitor interactions with your consent banner, ensuring compliance with user choices, especially for users from the EEA.
But what happens when a user chooses to deny all data collection? Previously, we would learn nothing about these users. Luckily, GA4 features a new system that upscales data to fill the gaps.
Upscaling allows you to view a pretty accurate estimation of the number of conversions occurring based on the people who have Ads personalisation set to ‘on’. This works even for the people who have refused to collect their data.
This is helpful because you are able to view a more accurate number of the conversions ‘actually’ occurring, which then helps for better budgeting.

9. Use Native Debug Mode to See Values in Real-Time Easier
With debug mode, you can view a list of interactions that have taken place on your website. This is a great option if you’re trying to test certain website features.
Let’s imagine that you’re testing consent mode on your website. With debug mode, you can ensure that data is being collected based on the selected level of consent. This is a level of detail you wouldn’t have found in earlier versions of Google Analytics. At least not without a third-party tool.
Using browser extensions would allow you to see that the pixel is being sent, but it was only until you went into the GA interface that you could see if it was being processed.
This whole system in one interface is definitely a cool ga4 feature.

10. Link Google Analytics 4 with Google Merchant Centre
Google Merchant Centre is a must for any eCommerce business. The tool allows you to upload data about your products, which can then be used to power your advertising.
You can now link Google Merchant Centre with GA4, allowing greater insights into your advertising. For example, you can learn the number of conversions and the total revenue attributed to organic search clicks.
By linking the tool with GA4, you’ll also gain access to the Merchant Centre interface within Google Analytics. This means greater convenience because everything is kept under one roof.

11. Sending reports via email scheduling
Administrators can add Google Marketing Platform (GMP) groups to recipient lists when sending reports via the ‘Schedule Email‘ and ‘Send Email‘ options.
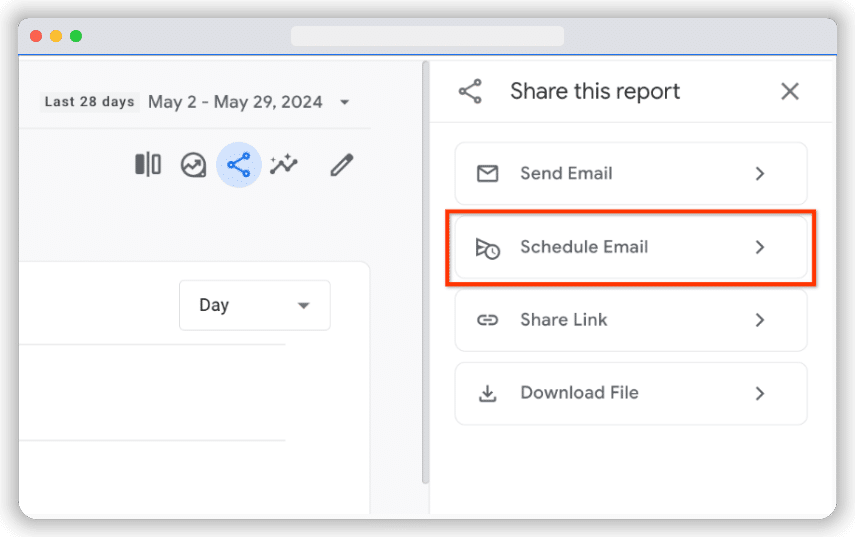
As an admin, you can set up to 50 standard and custom reports to be emailed regularly. This will help your team improve collaboration by keeping the right people in the loop. This would also be good for sending clients regular reporting based on their needs.
The reports include data for the chosen date range, with any filters or comparisons applied when first scheduled.
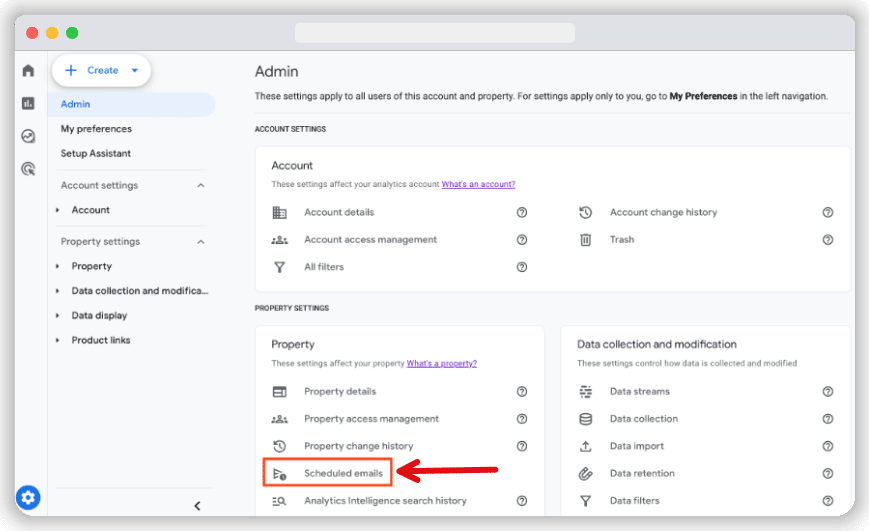
Managing scheduled reports
You can access the list of scheduled reports in your GA4 property, detailing their frequency, format, and status. You can also modify, review, and remove scheduled reports as needed.
To manage scheduled reports, navigate to ‘Admin‘, then under ‘Property‘, click on ‘Scheduled emails‘.
12. Advertising segments in GA4
The Advertising section in Google Analytics 4 now features advertising segments, which show users eligible for remarketing and ad personalisation in Google Ads. These segments are equivalent to audience segments in Google Ads Audience Manager.
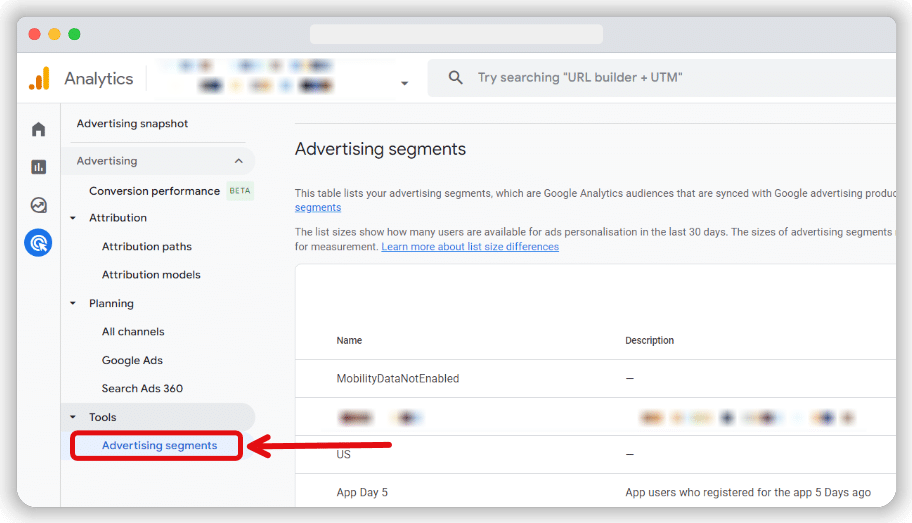
Advertising segments in GA4 consist of users synced with Google Advertising products for remarketing and personalised ads. You can view these segments and their eligible sizes in the Advertising Segments panel within GA4.
This update helps you better manage and understand your remarketing and personalisation strategies.
13. Custom event data import
Google Analytics 4 now supports importing custom event data, enabling you to combine standard fields and event-scoped custom dimensions with your existing data. This integration allows for more detailed and comprehensive reports.
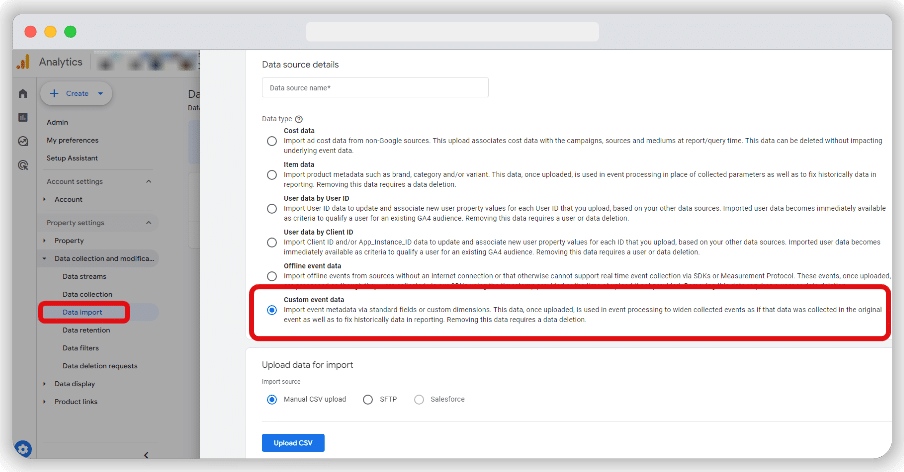
You can import data collected outside GA4 using standard fields and custom dimensions as join keys. This process helps you create custom reports that provide a complete view of imported and existing Analytics data.
How It Works
Custom event data import offers flexible options for joining and analysing data. Identify the information you want to add to your reports. If Analytics or other import types do not already capture it, use this feature to include it.
To use custom event data import, you must be an Editor or higher at the property level. Make sure to set up event-scoped custom dimensions in GA4 before starting the import process.
This is one of those GA4 features that enhances your ability to analyse and report on your data by integrating external event tracking data with your GA4 insights.
Top 3 Hidden Features in GA4
At our recent GA4ward event, Julie Brade, the Director of Measurement for MeasurementMarketing.io, highlighted some of the lesser-known but powerful GA4 features. These hidden features can significantly enhance your data analysis and reporting capabilities, helping you get more out of GA4.
Hidden gem 1: Library
You might be familiar with the interface below. This is the Reports Snapshot within Google Analytics 4. One of the new GA4 features is the way in which you can customise your reports.
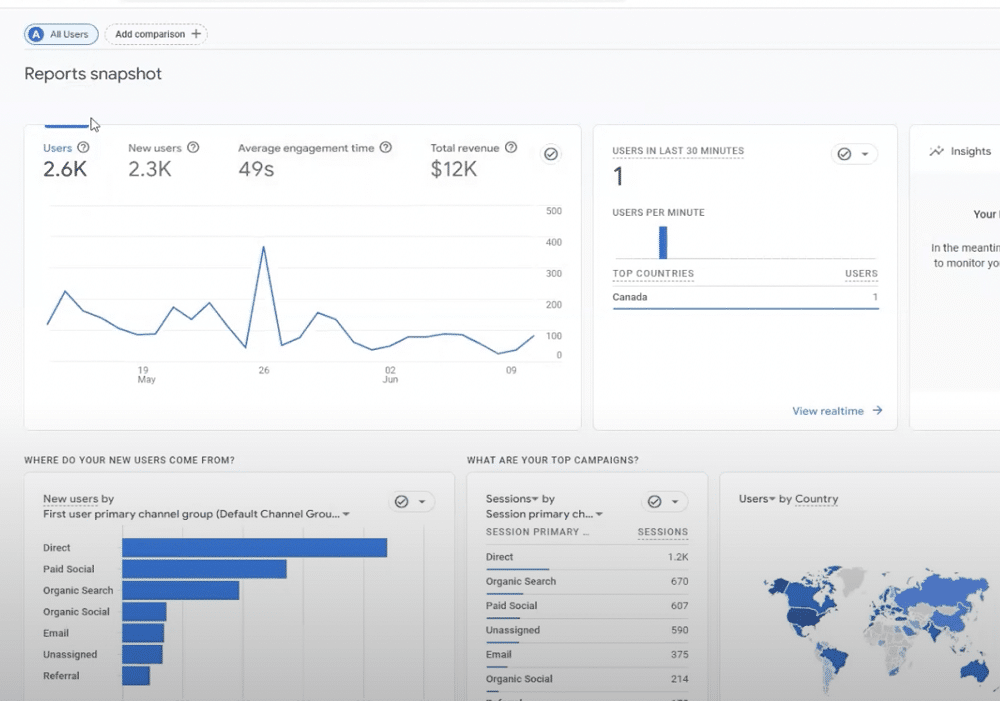
We can customise any report in GA4 simply by clicking the pencil icon. From there, we can alter our report in any way we like.
![]()
![]()
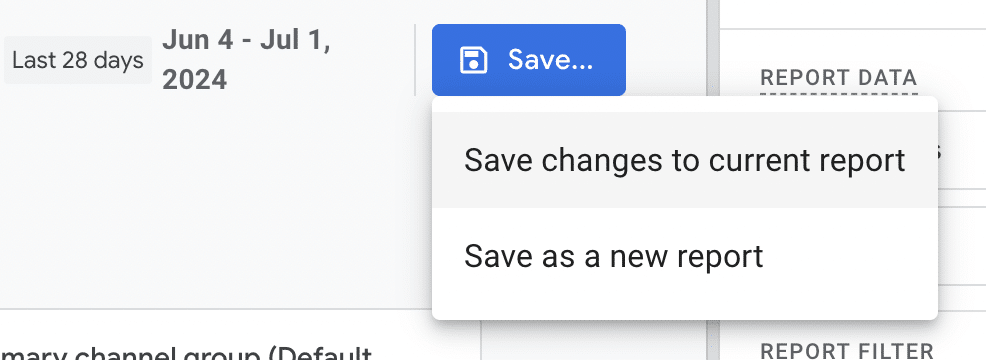
Once we’ve edited our report, we must hit ‘Save’.
We can choose to ‘Save changes to current report’. This changes a report for anyone who has access to a property. Or, we can choose ‘save as a new report’. This way, we maintain our old report and gain a separate, altered copy.

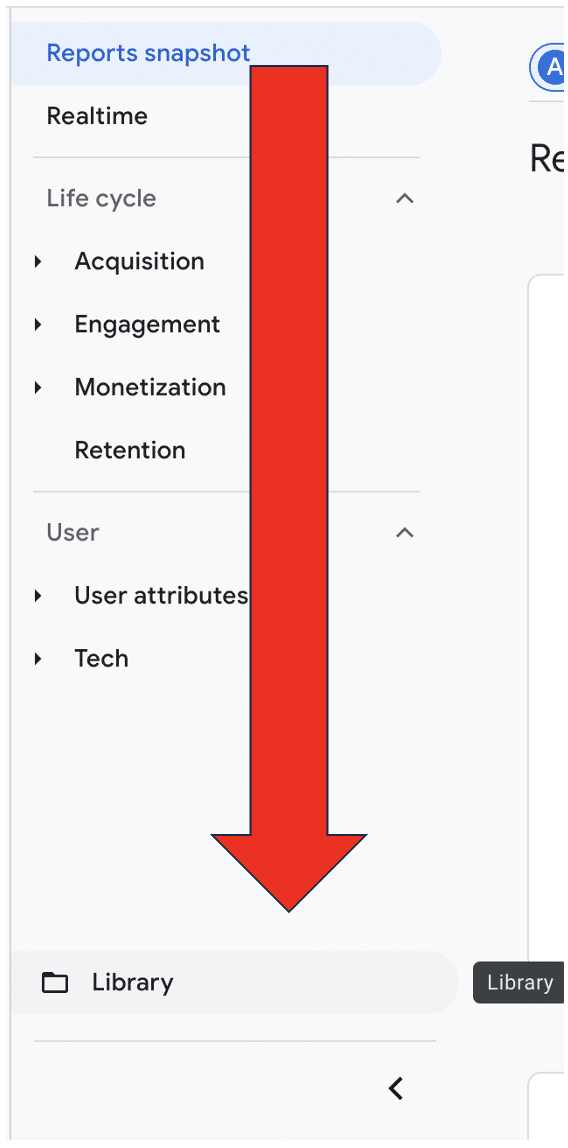
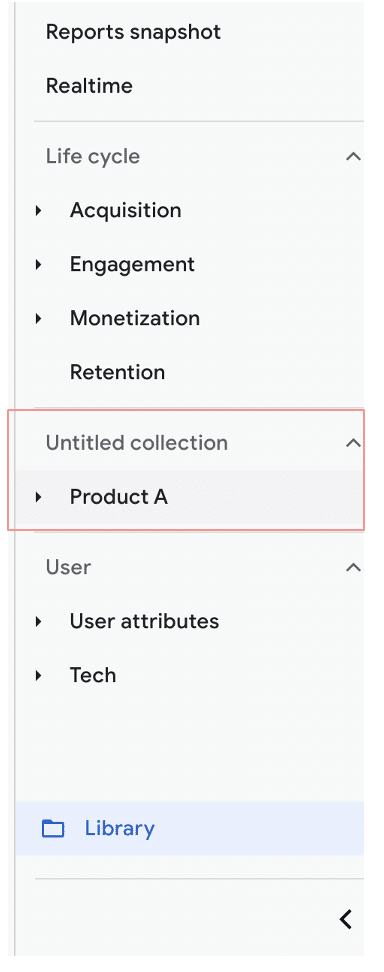
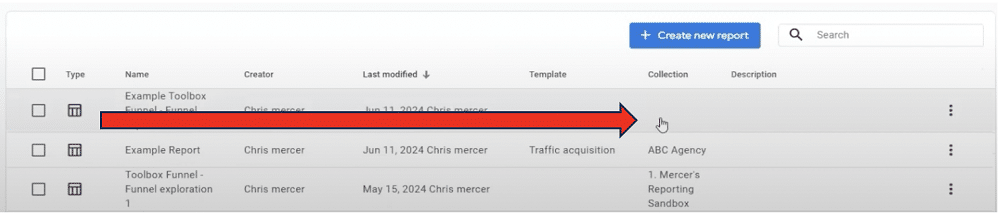
But once we’ve saved a new copy of the report, where can we find it? Look at the bottom of your ‘Reports’ toolbar, where you’ll find ‘Library’.
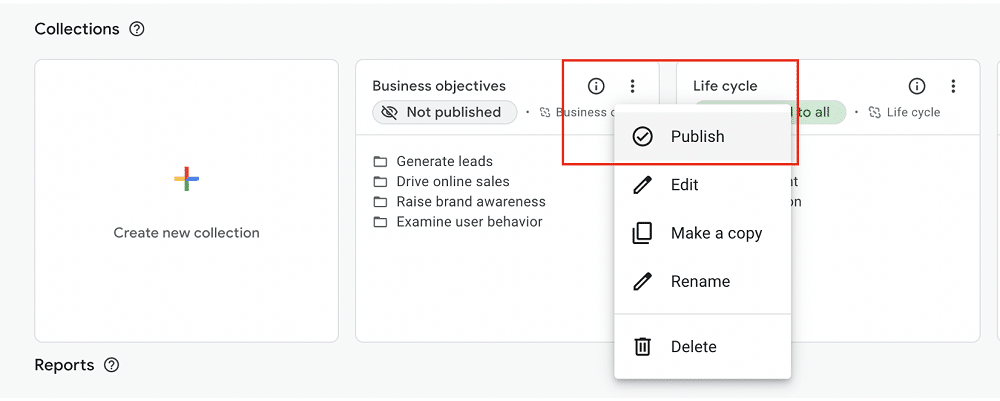
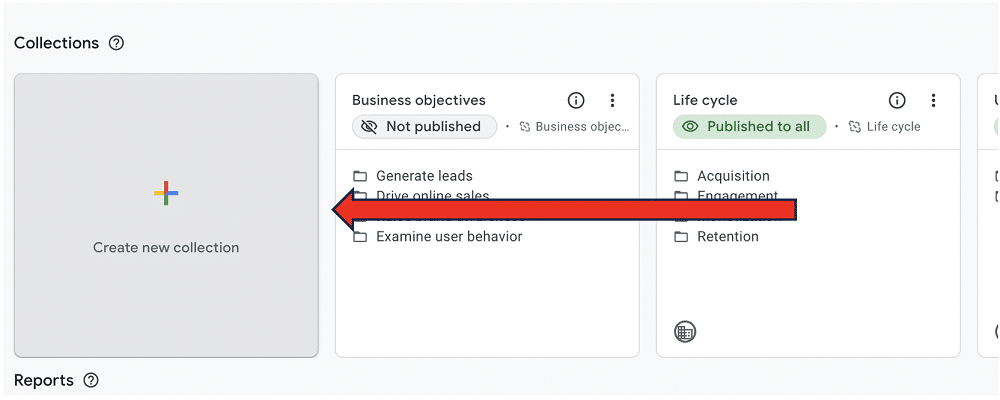
You’ll see several ‘Collections’ from the library screen containing different reports. You’ll notice that some collections are not currently published within your GA4. If you want these to become visible, select the dotted line and choose ‘Publish’.
But what about our new report? To find this, we must choose ‘Create new collection’.
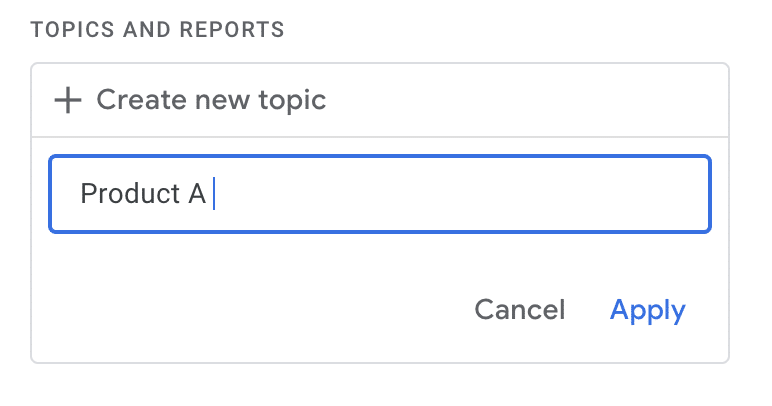
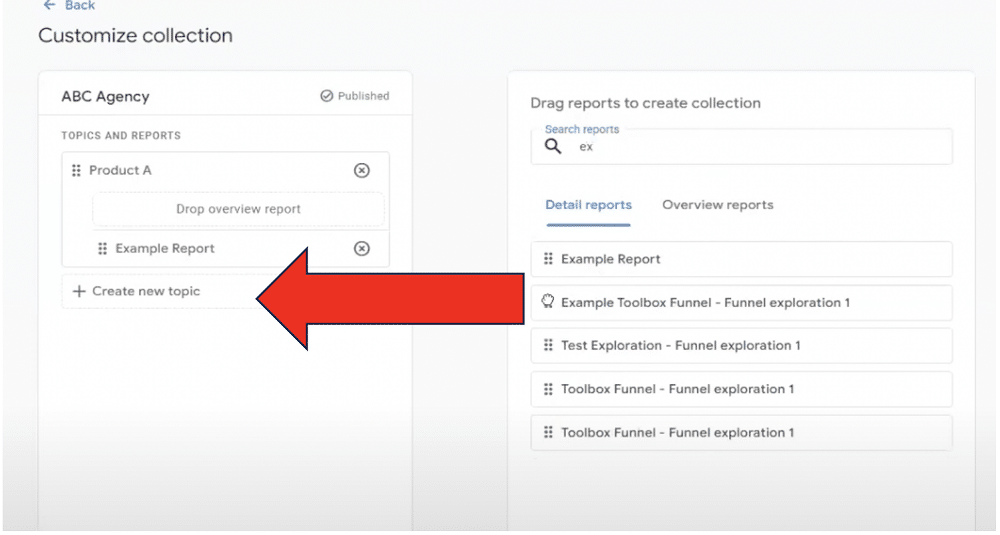
Within our collection, we can create ‘Topics’. These are useful if you have multiple products, as you can assign different reports to each product. For this example, we’ll name our topic ‘Product A’.
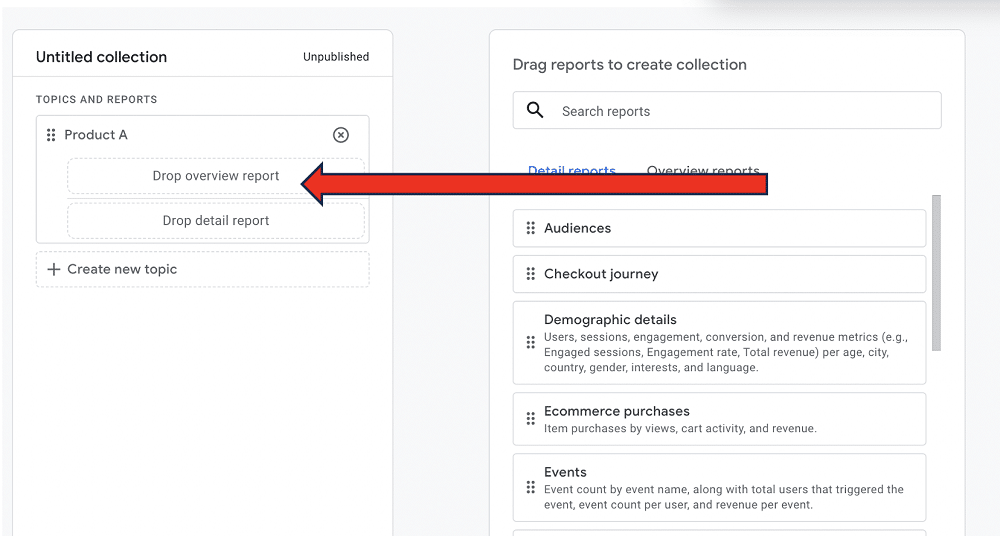
We can now drag and drop reports into our newly created topic. In the ‘Search reports’ section enter the name of your new report. When it appears, drag it into your topic. Finally, choose ‘Save’.
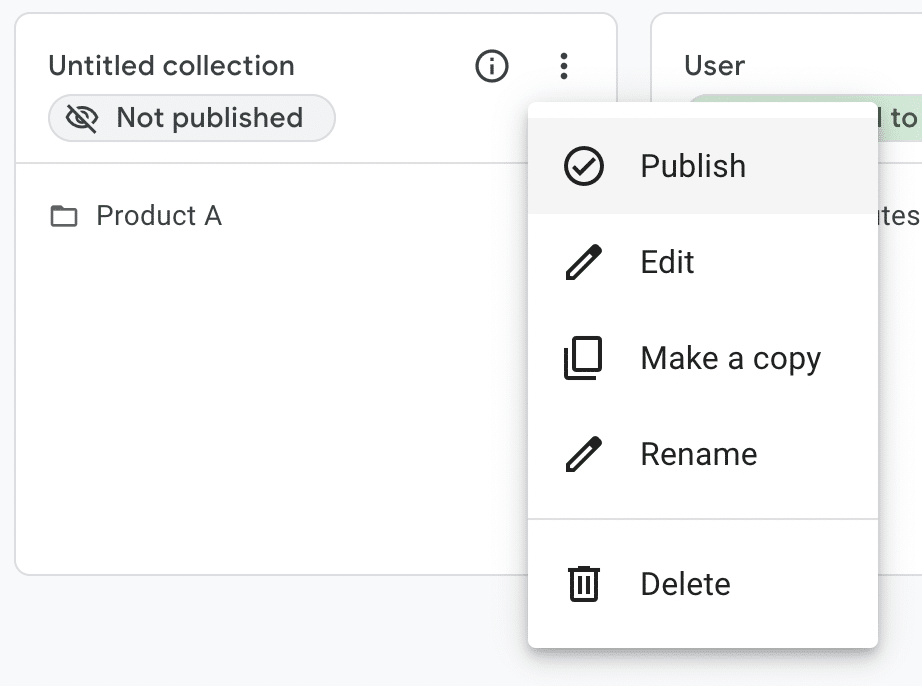
Now, in the ‘Library’, we need to find our new collection and publish it.
From our reports toolbar, we should now be able to see our collection and our report within it.
We can then customise this in any way we like. This time, we should choose ‘Save changes to current report’.
Hidden gem 2: Custom funnels
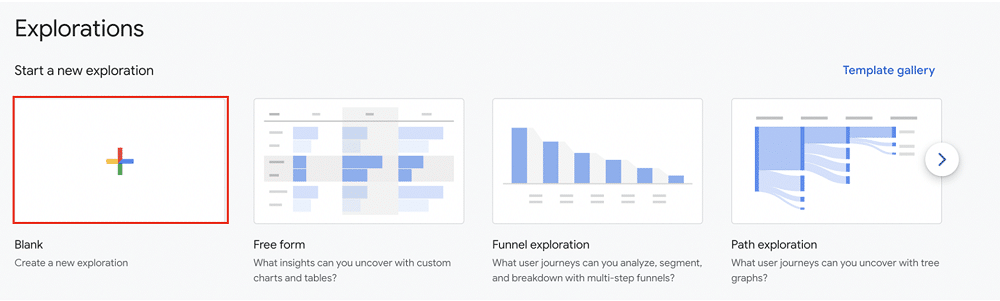
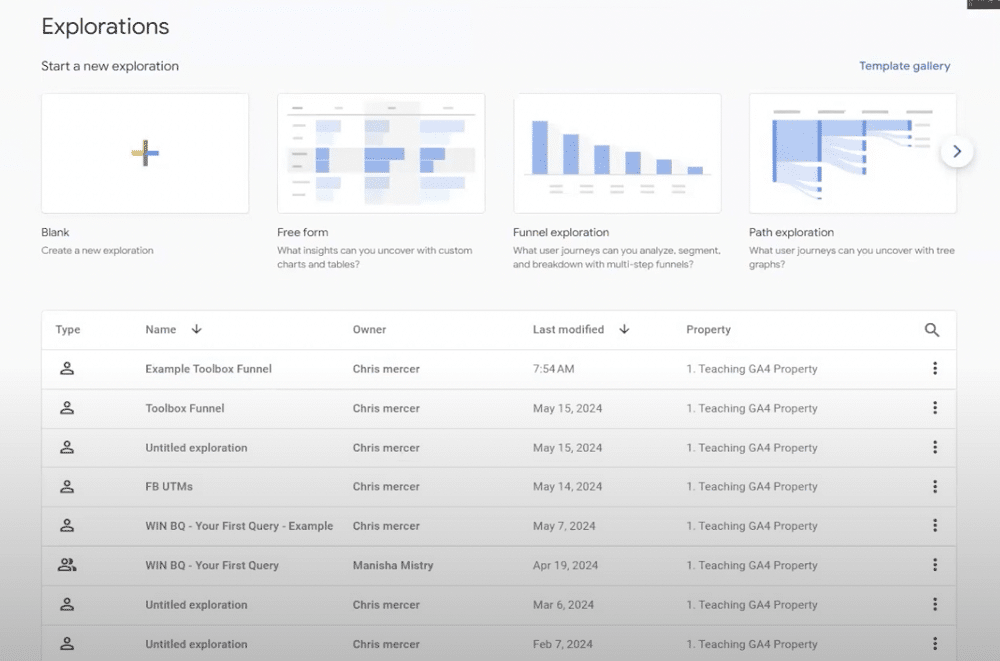
For the second of our hidden GA4 features, we’ll head to ‘Explore’ and create a blank exploration.
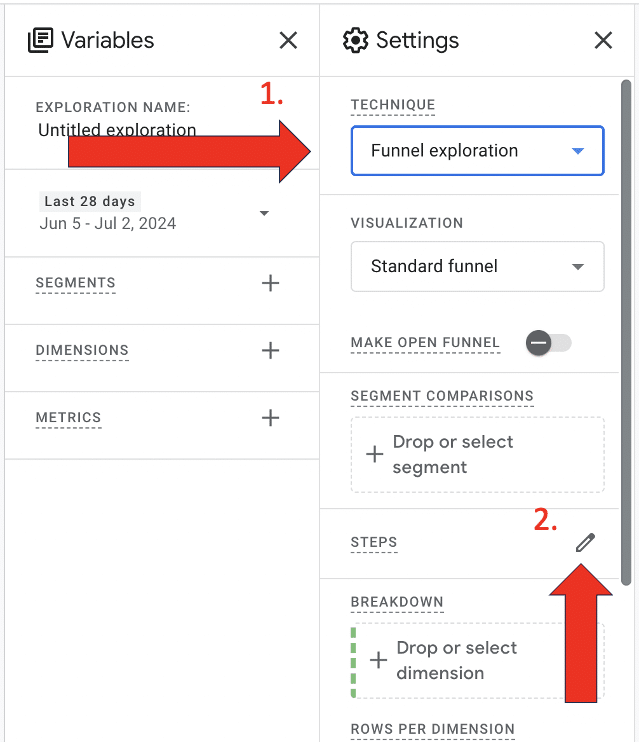
From the following page, choose ‘Technique’ and select ‘Funnel exploration’ from the drop-down menu. Next, look for ‘Steps’ and click the pencil icon.
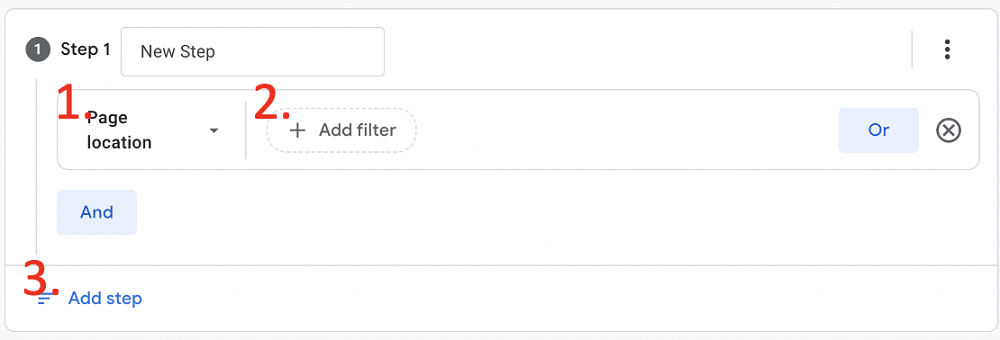
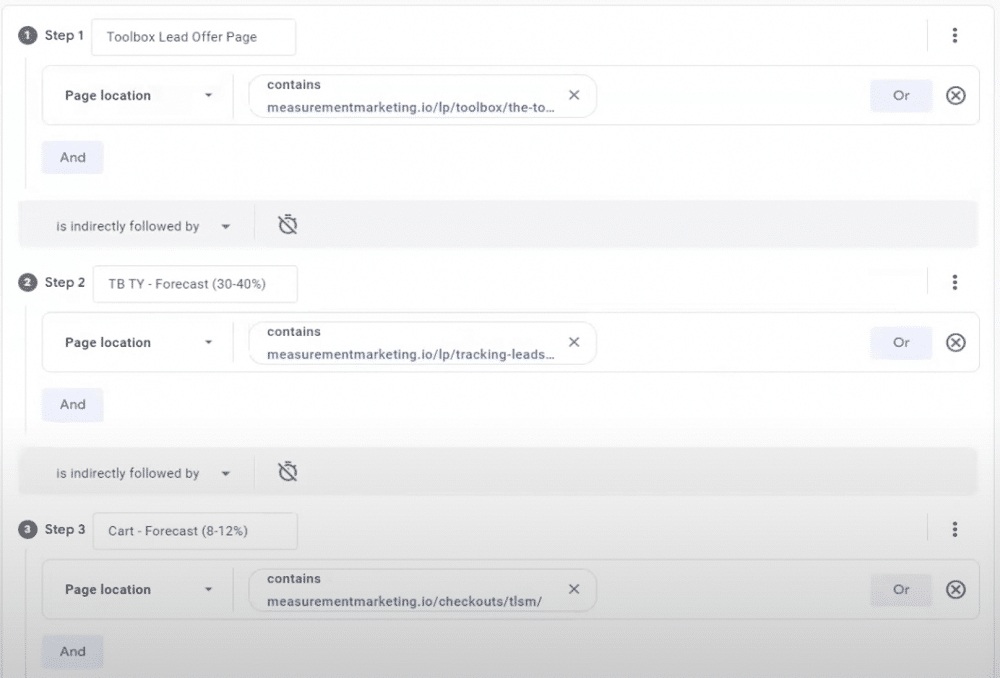
We’re now given the option of editing the funnel steps. Let’s begin by choosing ‘Add new condition’ under ‘Step 1’. For this example, we’ll choose ‘Page location’. Next, under ‘Add filter’ we’ll choose ‘contains’ and select a page from the top of our funnel.
Lastly, we’ll select ‘Add step’.
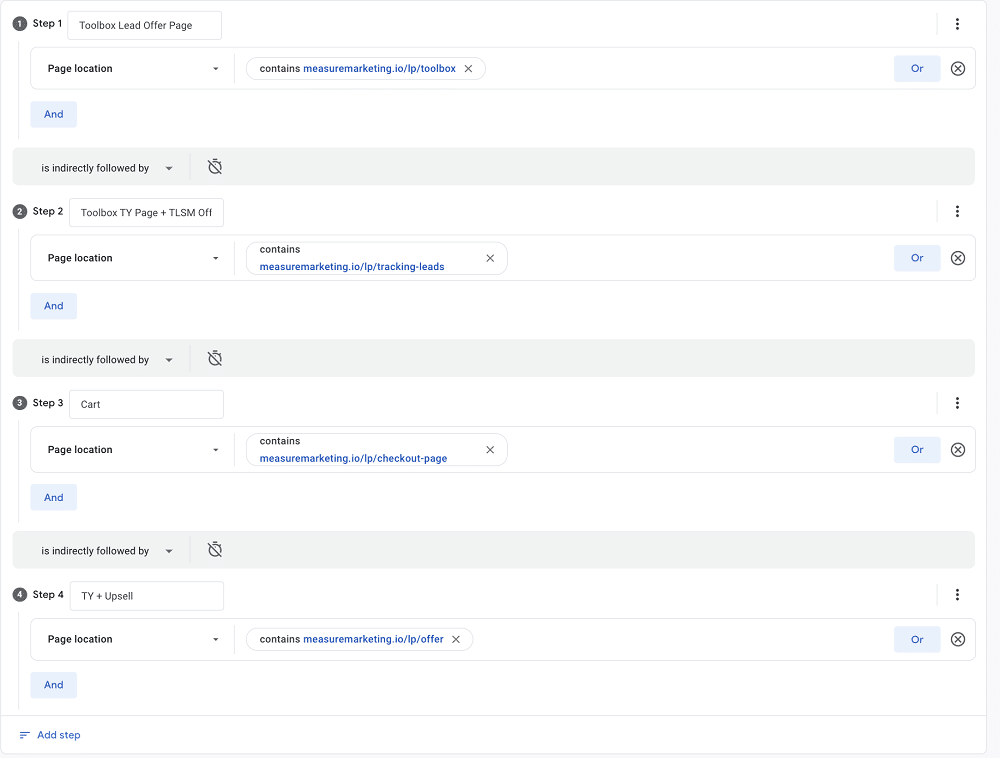
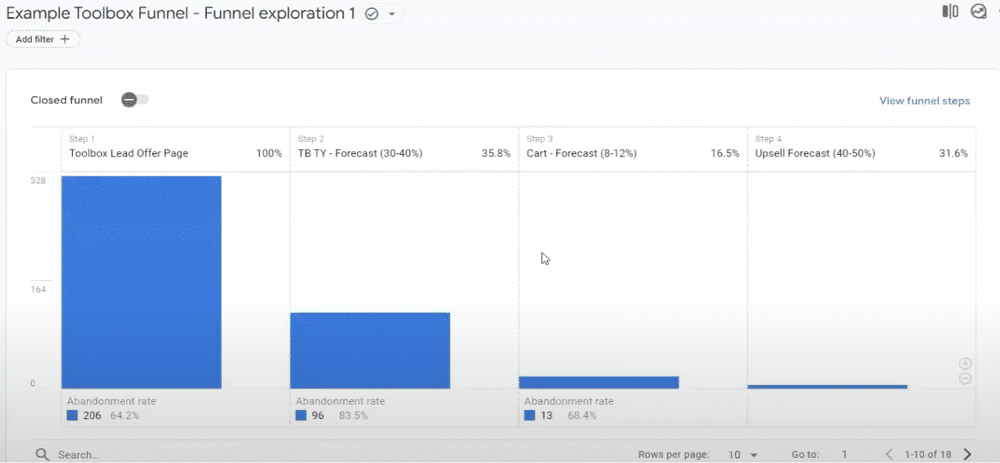
For each step in our funnel, we’ll repeat the same process. For each ‘contains’, we’ll select a page different from the customer journey. At the end of this process, your funnel should look similar to the image below.
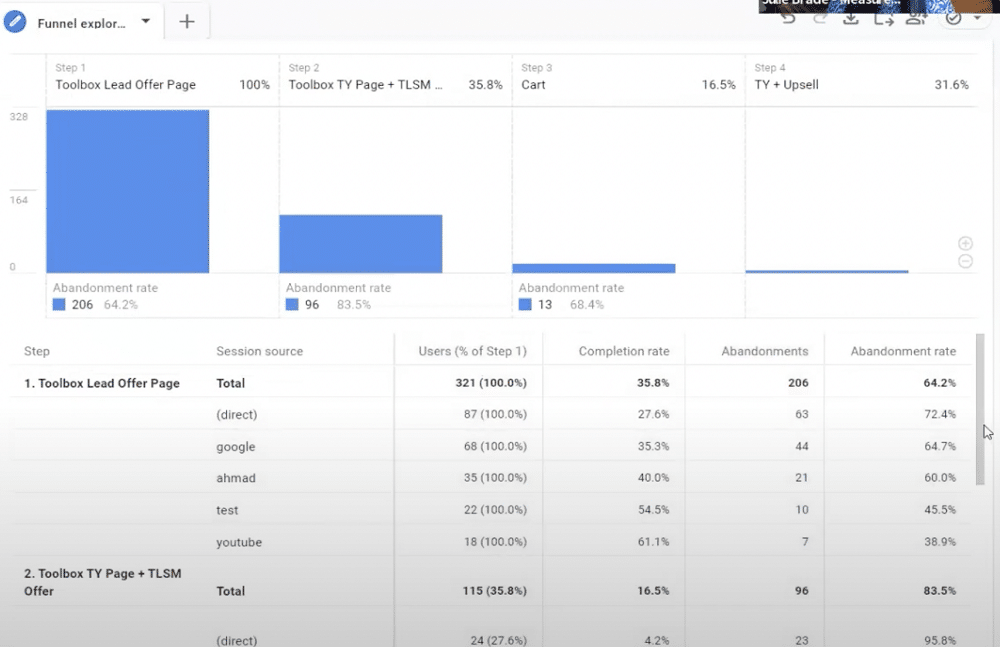
Each step represents a different part of the customer journey. We have an offer page, a thank you page, a cart page, and an upselling page.
Once you’re happy with your funnel, click ‘Apply’.
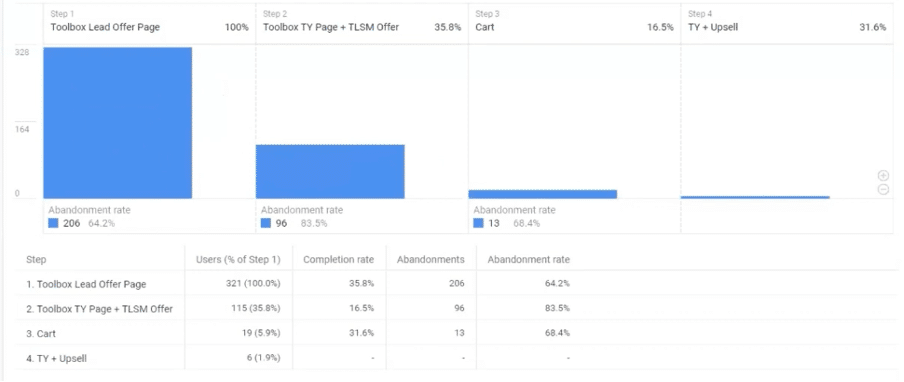
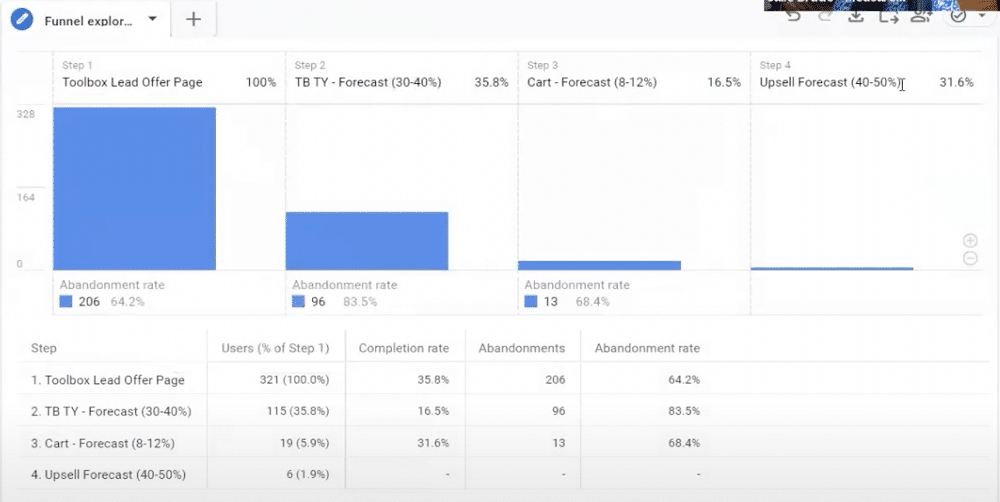
GA4 will now build a visualisation of our user journey. The image below shows that 35.8% of overall traffic made it to the second stage of the funnel. By stage 3, this number fell to 5.9%. By the final step, the number dropped further to 1.9%.
We can also see the ‘Completion rate’ for each step from here. It’s clear that of users who viewed an offer, 16.5% reached the cart. Lastly, we can see the percentage of users that abandoned each stage. We can see, for example, that we have a cart abandonment rate of 68.4%.
But what if we want to see the factors driving these results? To do so, let’s choose ‘Dimensions’ from the ‘Variables’ tab on the left of our screen.
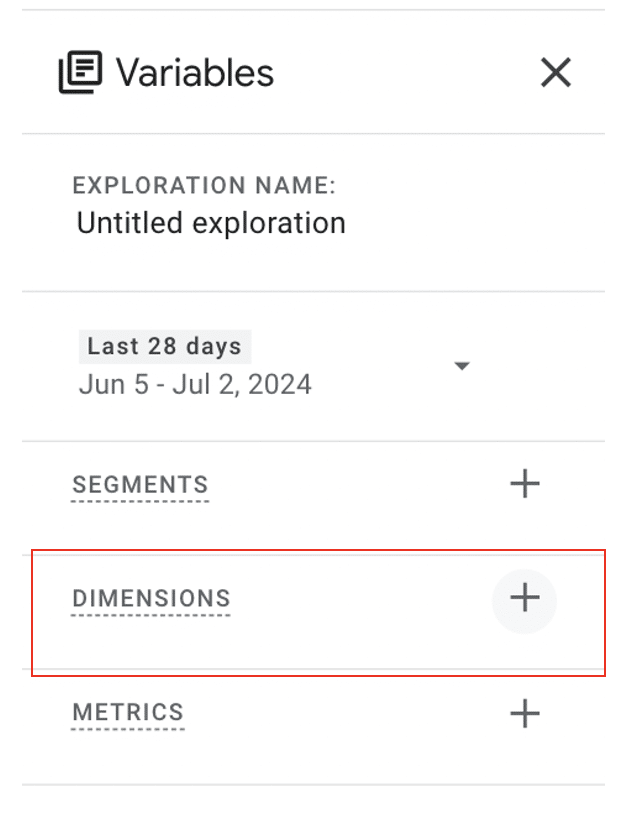
Next, select ‘Session source’, ‘Session campaign’, and ‘Session medium’. We’ll input these into our funnel.
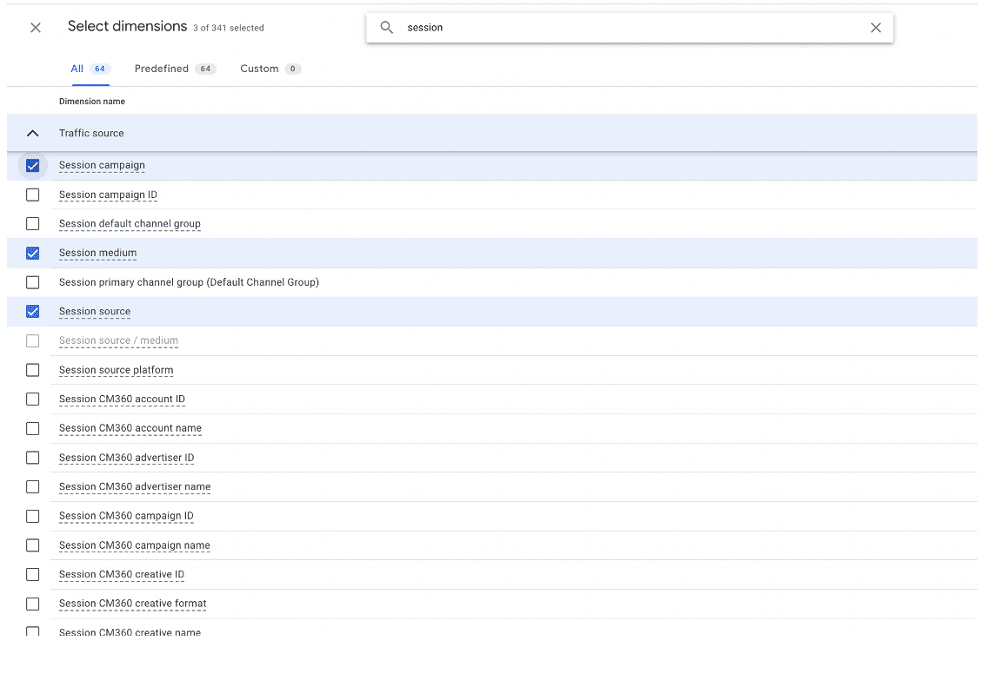
Now, under the ‘Settings’ section, select ‘Breakdown’. From here, we can select our added dimensions. For this example, we’ll choose ‘Session source’.
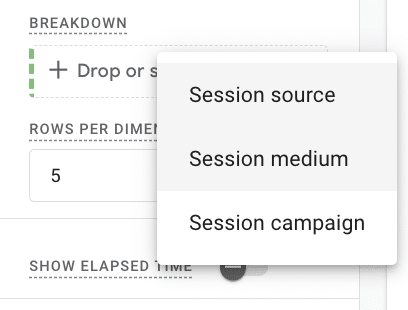
We can now compare the conversion rates from each step by traffic source. We could filter this further, e.g., to show only Facebook traffic.
WTF – Where’s the forecast?
When we set ourselves goals, it’s crucial to know if we’re headed in the right direction. However, it’s very hard to get a sense of direction from our funnel. Luckily, we can take a few steps to clarify this.
We’ll begin by editing the names of some of the steps of our funnel and adding a forecasted conversion rate. For example, let’s add ‘Forecast 30-40%’ to the name of step two. This is the conversion rate for the initial opt-in.
For step three, we’ll add ‘Forecast 8-12%’ – we know this is mainly cold traffic. We’ll add ‘Forecast 40-50%’ for the final step. We have a cheap offer, so we expect a high conversion rate.
Once we apply these changes, we can view our forecasted conversion rates from our funnel. This slight change makes it much easier to spot optimisation opportunities.
The image below shows that our conversion rate is higher than that forecasted in step 3. Conversely, though, for step 4, our forecasted rate is slightly higher than our current level.
Hidden gem 3: Easy access funnels
When we create an exploration, it is saved on the explorations page. Because of the way GA4 is built, it cannot be shared with other users who have access to our Google Analytics property.
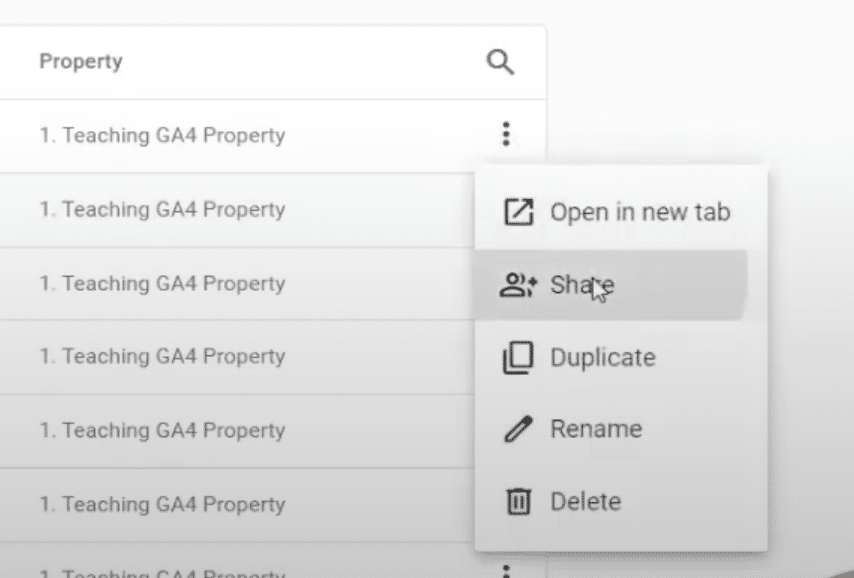
However, we can select the three dots next to any exploration and choose ‘Share’. This file will be ‘read-only’; other users cannot log in and make edits to the document.
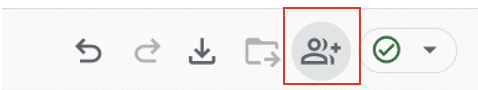
We must rely on additional GA4 features to allow other users to edit this report. One option is to ‘Save as a report in the library’. This option is on the far right of the screen on the report creator page.
Our report has now been added to the library but is still not contained within any of our collections.
For this example, let’s go back to the collection we created earlier in this article. As before, we simply need to click and drag our report into the collection. Once this is done, we can hit save.
Now, if we look under ‘Product A’, we can see that our report has been added alongside our earlier created report.

A copy of our report can now be viewed.
If we want to add additional information, we need to go back to explorations, edit the report, and save it to the library. We’ll then need to add the new version of the report to the collection.
Need help with GA4?
Navigating the massive amount of ga4 features can be challenging. Whether you need assistance optimising your data collection or making the most of GA4’s advanced reporting capabilities, MeasureMinds Group is here to help.
Get a personalised assessment and expert guidance to use the exciting features of GA4. Contact us for a free consultation to get top-notch web analytics recommendations.
How does #7 (Enable Anti-Spam and Non-Human Activity with Measurement Protocol – a ‘Secret Key’ ) work?
I thought Measurement protocol is for back-end requests to GA (eg if you want server side to track your user journey).
Yes. This feature can only be used if GA4 is deployed via GTM Server-side